
Envisioning Technology. Researched and designed by technologist Michell Zappa, Envisioning Technology is a speculative and subjective overview of potential future technologies.
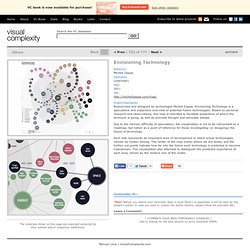
Based on personal research and observations, this map is intended to facilitate predictions of where the technium is going, as well as provoke thought and stimulate debate. Due to the intrinsic difficulty of speculation, the visualization is not to be interpreted as a roadmap, but rather as a point of reference for those investigating (or designing) the future of technology.
Each hub represents an important area of development to which actual technologies (shown as nodes) belong. The center of the map marks where we are today, and the further out points indicate how far into the future each technology is predicted to become mainstream. Net Worked » Blog Archive » Data Visualization and Infographic Sites To Bookmark. By Jodie Mozdzer Gil | June 17th, 2011 VisualJournalism.com graphic As I work on my master’s project in news infographics, I’ve started following several blogs and websites that have good data visualization, or tips on how to do it yourself.
I thought this would be a good forum to share a blogroll. Explain the world with maps. - UUorld. What is UUorld? UUorld (pronounced "world") provides an immersive mapping environment, high-quality data, and critical analysis tools. Great explanations are unfortunately scarce, but UUorld makes them easier to achieve through interactive four-dimensional maps. Our solution has three simple parts: Draw on extensive, organized data. Explore and grasp complex patterns through intuitive visual analytics. Trailmeme.