
OmniGraffle: Powerful Diagramming App For Mac And iPad. If you are a Mac or iPad user who requires creating diagrams, then one of the best applications that you can use is OmniGraffle.

With OmniGraffle you can create amazing diagrams for tasks, activities, processes and even basic posters. What makes this app stand out from the rest is its adaptability to help you produce anything from complex diagrams to basic posters for something as basic as a yard sale. How to Make a Layered Wheel Diagram Template in PowerPoint 2010. This article will explain how to design a simple but useful wheel diagram with multiple layers.
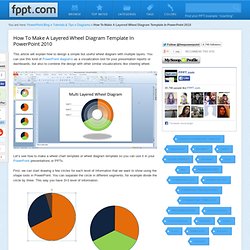
You can use this kind of PowerPoint diagrams as a visualization tool for your presentation reports or dashboards, but also to combine the design with other similar visualizations like steering wheel. Let’s see how to make a wheel chart template or wheel diagram template so you can use it in your PowerPoint presentations or PPTs. First, we can start drawing a few circles for each level of information that we want to show using the shape tools in PowerPoint. You can separate the circle in different segments, for example divide the circle by three. This way you have 3×3 level of information. Duplicate the circle many times (3 times for example) and then modify the yellow diamond to match the design above. Next, add a simple shadow effect to the circle on the background. To add the shadow, you can right click on the shape and then access Format Shape options. . (2 votes, average: 5.00 out of 5) Gliffy: Create UML, UI Designs, Flowcharts, Diagrams, Floor Plans And More.
Gliffy is an online platform for creating diagrams, floor plans, technical drawings, business models, etc.
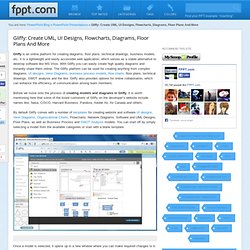
It is a lightweight and easily accessible web application, which serves as a viable alternative to desktop software like MS Visio. With Gliffy you can easily create high quality diagrams and instantly share them online. Home. Création de diagrammes en ligne, Graphity. Graphity est une application en ligne pour réaliser des diagrammes : organigrammes, réseaux, algorithmes, structure d’une base de données… Il s’agit d’une application en anglais réalisée en Flash fonctionnant par glisser déposer d’objets à sélectionner dans une bibliothèque.
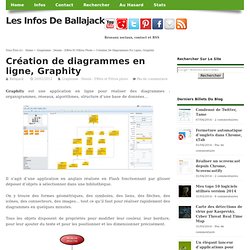
On y trouve des formes géométriques, des symboles, des liens, des flèches, des icônes, des connecteurs, des images… tout ce qu’il faut pour réaliser rapidement des diagrammes en quelques minutes. Tous les objets disposent de propriétés pour modifier leur couleur, leur bordure, pour leur ajouter du texte et pour les positionner et les dimensionner précisément. Chaque diagramme peut être dessiné dans un onglet séparé. A la fin du travail on sauvegarde son diagramme, on peut aussi l’imprimer et l’exporter au format PNG. Source : Graphity. Graphity Diagram Editor. Create Flow Charts, Network Diagrams, Circuits & More With Dia. Ever found yourself required to make flowcharts, network diagrams, circuit sketches and more at work or for studies?
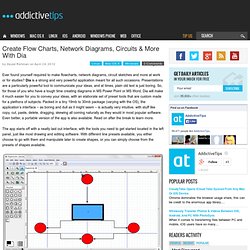
Dia is a strong and very powerful application meant for all such occasions. Presentations are a particularly powerful tool to communicate your ideas, and at times, plain old text is just boring. So, for those of you who have a tough time creating diagrams in MS Power Point or MS Word, Dia will make it much easier for you to convey your ideas, with an elaborate set of preset tools that are custom made for a plethora of subjects. Packed in a tiny 19mb to 30mb package (varying with the OS), the application’s interface – as boring and dull as it might seem – is actually very intuitive, with stuff like copy, cut, paste, delete, dragging, skewing all coming naturally as they would in most popular software.
Even better, a portable version of the app is also available. There’s more than meets the eye when it comes to these shapes. Download Dia for Windows | Linux | Mac. Dia. Welcome to Dia's new homepage.
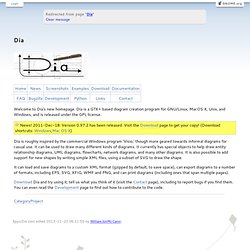
Dia is a GTK+ based diagram creation program for GNU/Linux, MacOS X, Unix, and Windows, and is released under the GPL license. Dia is roughly inspired by the commercial Windows program 'Visio,' though more geared towards informal diagrams for casual use. Cacoo - Create diagrams online Real time collaboration. Cacoo Outil collaboratif pour creer des schemas. Cacoo: Create Diagrams And Presentations Online With Real Time Collaboration. In some recent posts we have reviewed a number of feature rich web applications for creating diagrams and presentations.
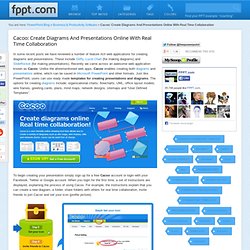
These include Gliffy, Lucid Chart (for making diagrams) and SlideRocket (for making presentations). Recently we came across an awesome web application known as Cacoo. Unlike the aforementioned web apps, Cacoo enables creating both diagrams and presentations online, which can be saved in Microsoft PowerPoint and other formats. Online Diagram & Flowchart Software. Diagrams Online. Lucid Chart. Creer des diagrammes en mode collaboratif.