
Excel Forums - Excel User Group. The Spreadsheet Page - Excel Tips. Excel Tips Excel has a long history, and it continues to evolve and change.
Consequently, the tips provided here do not necessarily apply to all versions of Excel. In particular, the user interface for Excel 2007 (and later), is vastly different from its predecessors. Therefore, the menu commands listed in older tips, will not correspond to the Excel 2007 (and later) user interface. Contextures Excel Tips, Excel Tutorials and Excel Examples. Pearson Software. Advanced Excel Skills - What are they & How to become Advanced Excel user? Fonctions XL en 9 langues. Learn Excel from MrExcel Video Podcasts. The Preview is Ending!

Free Stuff! And Something New that you may not have seen in Excel 2013. " This is Bill's First Podcast about "Power View" - a New Feature in Excel 2013! This is very powerful dashboarding tool that is new to Excel for 2013. Note that Today's podcast stretches to 9 minutes because of the cool stuff we have to talk about today! Also, The free preview download of Office365 is about to end. Finally, a Giveaway! First Prizes: $99 one-year subscription to Office 2013. Watch today's Podcast, Episode #1634, get all of the details and go to it! Excel Tutorial. Formulas. ExcelIsFun. Excel Array Formulas. Formulas NOTE: This page is no longer updated.
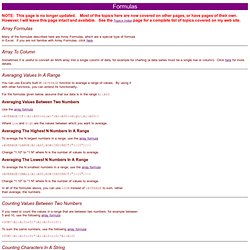
Most of the topics here are now covered on other pages, or have pages of their own. However, I will leave this page intact and available. See the Topics Index page for a complete list of topics covered on my web site. SUMPRODUCT Function. One of the most basic functions in any spreadsheet is to return an answer based upon some condition.
This becomes especially useful when counting or summing based upon that condition. One condition is useful, and is easily achieved using COUNTIF or SUMIF . These are incredibly useful and flexible functions, but limited as they are to single conditions, they can be lacking. Multiple conditions, such as counting the number of items sold by part number AND by month, greatly extends the functionality of our solution. There are a number of ways that this can be achieved within Excel, but this paper is focusing on one particular function, the SUMPRODUCT function, which by creative use has evolved to a flexibility undreamt of by its originators in Microsoft.
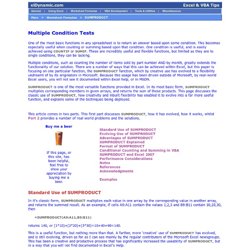
Array Formulas in Excel – Excel Array Formula Syntax & Array Constants. Array Formulas in Excel An Array Formula in excel is a formula that uses arrays instead of single cell value as input.Excel Array Formulas can be thought of as many formulas packed into a single super formula.
In this article we will take a look at the syntax of an array formula, its various parts, learn how to write a basic array formula and then graduate on to writing the more powerful versions of it. Before we begin, let us first understand what an “array” means – a construct at the very core of array formulas. Excel Array Formulas Beg - Advanced PlayList. Excel Array Formulas Beg - Advanced. Learn about the power of Array Formulas.
Some of the topics covered are: 1.Basics of array formulas 2.Eliminate columns and formula and replace them with a single array formula 3.Learn how to use Array Functions 4.See great time & space saver formula for Lookup-Adding and Counting Unique Records. Challenge Results. Challenge for for June/July 2008: Wildcard VLOOKUP This was a fascinating challenge.
After reading through all the solutions, there are three main winners, all of whom used a formula to solve the problem: Barry Houdini receives a podcast DVD and a LiveLessons Power Excel DVD for his formula posted here. The formula is =LOOKUP(2^15,SEARCH(D$2:D$10,A2),E$2:E$10). His formula returns the last match in the range. Fractions rounded to 1/4, 1/8, 1/16, 1/32, 1/64, 1/128.
Location: Home page: [View without Frames] The formatted display of fractional measurements in Excel leaves a lot to be desired.

This example and the formulas shown below were generously provided by Bernie Deitrick as a follow-up to a posting 2000-08-04 in the microsoft.public.excel.misc newsgroup. Bernie's formulas will be simplified after comments from Harlan Grove and corrections from by Ron Rosenberg on 2003-01-03 The corrections to be made will allow the numbers to be treated arithmetically, though they are being formatted strictly for display. I believe the formula on this page will need some revision based on the following advice by Ron Rosenberg on 2003-01-26. Find if a character is in a range in Microsoft Excel. Excel. 50+ (Mostly) Free Excel Add-Ins For Any Task. There is no doubt about it – Excel is one powerful tool.
However, it has does have its limitations. That is where add-ins come in to play. Microsoft has been kind enough to open its code base and allow third party developers to extend the functionality of Excel. These add-ins make data analysis and manipulation easier and have practical applications in the business world. The XY Chart Labeler Add-in. A very commonly requested Excel feature is the ability to add labels to XY chart data points.
The XY Chart Labeler adds this feature to Excel. The XY Chart Labeler provides the following options: Add XY Chart Labels - Adds labels to the points on your XY Chart data series based on any range of cells in the workbook. Move XY Chart Labels - Moves the entire set of data labels or individual labels in any direction and in the increment of your choosing. Manual Labeler - When you don't want to label an entire data series, but rather use data labels to highlight specific data points, the manual labeler allows you to do this.
Sparklines for Excel® 40+ Resources For Advanced Excel & VBA Programming. With some solid Excel chops, you can do amazing things with Excel. Fancy yourself an Excel journeyman and think you are ready to learn the more advanced features of Excel? After you get basic spreadsheets down pat, the learning curve in Excel gets steep quick. Advanced data analysis requires the use of PivotTables and Visual Basic. Once you start using the more advanced functionality in Excel you can perform some serious business intelligence analysis and do some very cool things with advanced charting also known as data visualization. However, once the training wheels come off, the video training tutorials suddenly disappear.
Formation Excel. Query. Beyond Excel: Parameterized Query. Multiple relationships between tables in Excel. Create a Reverse Pivot Table. Median in Pivot Table in Excel 2010. Clear Old Items in Pivot Table Drop Downs. There is a page on the Contextures website that describes how to clear old items in pivot table drop downs. This week, Laurence emailed me about a problem he was having with those instructions, and you can keep reading, to see how we solved the problem. Old Items in the Pivot Table Those old items can appear if you change the pivot table source data – for example, you might remove a few obsolete products, or change a sales rep's name. When you refresh the pivot table, the new data can appear, but the old names still show up in the drop down lists, that you use for filtering. Manually Clear the Old Items One way to clear the old items is to do the steps manually: Remove pivot field(s) from the pivot table layoutRefresh the pivot tablePut the pivot field(s) back in the pivot table layout.
Simulation & Optimization. Risk Solver Pro. Understand and manage risk with the easiest, fastest and most powerful Excel tool Industry Leading Monte Carlo Simulation and Risk Analysis Over 20+ years of our own R&D and working directly with Microsoft, most recently implementing the new, more-accurate probability distribution functions built-in to Excel 2010 and Excel 2011, has enabled us to bring you a proven accurate Monte Carlo simulation tool which is much faster than competing alternatives.
Data Tables & Monte Carlo Simulations in Excel – A Comprehensive Guide. Posted on May 6th, 2010 in All Time Hits , Analytics , Charts and Graphs , Excel Howtos , Featured , Huis , Learn Excel , Posts by Hui , simulation - 162 comments This is a Guest Post by Hui, an Excel Ninja and One of the Moderators of our Forums. Please note that this post is unusually large by Chandoo.org standards. If anybody asks me what is the best function in excel I am drawn between Sumproduct and Data Tables, Both make handling large amounts of data a breeze, the only thing missing is the Spandex Pants and Red Cape!
How often have you thought of or been asked “I’d like to know what our profit would be for a number of values of an input variable” or “Can I have a graph of Profit vs Cost vs …” This post is going to detail the use of the Data Table function within Excel, which can help you answer those questions and then so so much more. How often have you thought “I’d like to know what our profit would be for a +/- 10, 20 and 30 % variance in the costs” ? Building your First Monte Carlo Simulation Model in Excel. Tools for Excel Users. Get the insight and answers you need with the leading optimization and simulation tools for Excel.
With Frontline Solvers you can build better models faster, optimize the biggest models with amazing speed, and handle the most complex optimization and simulation problems. Depending on the problem and size of the business, cost savings and profit improvements of up to US$1 million or more are not uncommon.