
More adventures in overlay: point in polygon. Counting the number of points in a polygon is a common overlay operation.
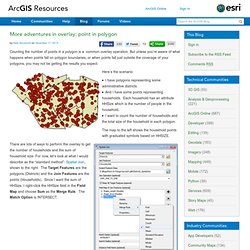
But unless you’re aware of what happens when points fall on polygon boundaries, or when points fall just outside the coverage of your polygons, you may not be getting the results you expect. Here’s the scenario: I have polygons representing some administrative districts.And I have some points representing households. Each household has an attribute HHSize which is the number of people in the household.I want to count the number of households and the total size of the household in each polygon.
The map to the left shows the household points with graduated symbols based on HHSIZE. There are lots of ways to perform the overlay to get the number of households and the sum of household size. Now let’s go back to the Households table and get some statistics. Huh? Finding boundary points To find boundary points, use the Select By Location tool found in the Selection menu of ArcMap. Finding points outside Near Summary Statistics. SIG sem grilhetas. O Walking time é um plugin python para QGIS que usa a Tobbler’s hiking function para estimar o tempo de percurso ao longo de uma linha consoante o declive.
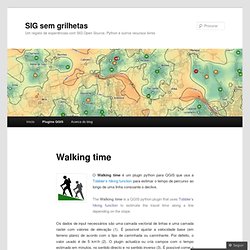
The Walking time is a QGIS python plugin that uses Tobbler’s hiking function to estimate the travel time along a line depending on the slope. Os dados de input necessários são uma camada vectorial de linhas e uma camada raster com valores de elevação (1). É possível ajustar a velocidade base (em terreno plano) de acordo com o tipo de caminhada ou caminhante. Por defeito, o valor usado é de 5 km\h (2). O plugin actualiza ou cria campos com o tempo estimado em minutos, no sentido directo e no sentido inverso (3). The input data required are a vector layer with lines and a raster layer with elevation values (1). O plugin pode também ser usado para preparar uma rede (grafo) para realizar análise de redes onde se queira usar como custo o tempo de percurso. Repositório QGIS | QGIS repository: Código | Code: Reportar bugs | Bug report:
SAM - Spatial Analysis in Macroecology. Geospatial Revolution Project. Epidemics in Western Society Since 1600. Syllabus Professor Frank Snowden, Andrew Downey Orrick Professor of History Description This course consists of an international analysis of the impact of epidemic diseases on western society and culture from the bubonic plague to HIV/AIDS and the recent experience of SARS and swine flu.

Leading themes include: infectious disease and its impact on society; the development of public health measures; the role of medical ethics; the genre of plague literature; the social reactions of mass hysteria and violence; the rise of the germ theory of disease; the development of tropical medicine; a comparison of the social, cultural, and historical impact of major infectious diseases; and the issue of emerging and re-emerging diseases. Texts Brandt, Allan. Barnes, David. Chase, Marilyn. Defoe, Daniel. Fenn, Elizabeth. Snow, John. Snowden, Frank. Snowden, Frank. Snowden, Frank. Verghese, Abraham. Requirements Grading Join a Study Group View study group OpenStudy is not affiliated with Yale University.
Global Administrative Areas.