
Des tutoriels faits par et pour des journalistes. Présentation de SocioViz pour collecter et cartographier Twitter. Un nouvel outil vient de voir le jour dans le domaine de la Social Network Analysis (SNA) : SocioViz, qui permet d’analyser rapidement et visuellement des conversations sur Twitter. Présentation. Update : depuis Octobre 2015, Socioviz propose une version « premium » pour 19$ par an permettant la collecte et l’analyse de 5000 tweets sur les 7 derniers jours. (en savoir plus) Présentation de SocioViz C’est une nouvelle ressource pour les professionnels de l’analyse des réseaux sociaux. Share and Discover the best programming tutorials online. 50+ (Mostly) Free Excel Add-Ins For Any Task - Skilledup.com.
There is no doubt about it – Excel is one powerful tool.

However, it does have its limitations. That is where add-ins come in to play. Microsoft has been kind enough to open its code base and allow third party developers to extend the functionality of Excel. Styles. Welcome to MinnPost Styles, a super-fly, style guide focused on interactive and news applications made by the MinnData team.
A work in progress. About MinnPost Styles is a CSS and JS framework. The CSS source is written in SASS and is extendable if you want to include the framework via SASS. Lots of inspiration and some code was taken from such amazing projects such as Bootstrap, Mapbox.js, and more. Browser support MinnPost Styles aims to support all modern browsers and Internet Explorer 8 (IE8). Journalisme et code : 10 grands principes de programmation expliqués. Transformer rapidement un geocode en coordonnées. Pense-bête data : transformer un geocode en coordonnées géographiques pour ensuite l'exporter dans n'importe quel format - Veille d'un dataïste (mais pas que) Draw simple maps with no effort with d3.js and datamaps.js.
I started working on a new project for BBC News Labs this morning, and that project heavily relies on a map.
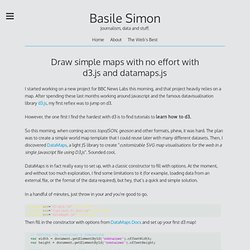
After spending these last months working around Javascript and the famous datavisualisation library d3.js, my first reflex was to jump on d3. However, the one first I find the hardest with d3 is to find tutorials to learn how to d3. How to Lie with Data Visualization. Ravi Parikh — Apr 14, 2014 — Data visualization is one of the most important tools we have to analyze data.
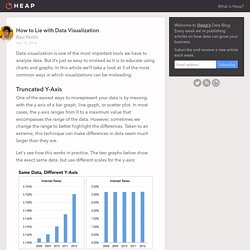
But it’s just as easy to mislead as it is to educate using charts and graphs. In this article we’ll take a look at 3 of the most common ways in which visualizations can be misleading. Truncated Y-Axis One of the easiest ways to misrepresent your data is by messing with the y-axis of a bar graph, line graph, or scatter plot. Let's see how this works in practice. @joelmatriche » Le blog de jo. Dans une cellule contenant des centaines, sinon des milliers de caractères, comment extraire la portion de texte et les données qui vus intéressent ?
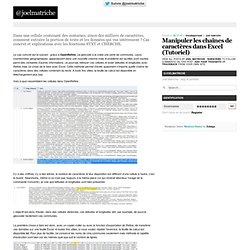
Cas concret et explications avec les fonctions STXT et CHERCHE. Le cas concret est le suivant : grâce à OpenRefine, j’ai géocodé à la volée une série de communes. Leurs coordonnées géographiques apparaissent dans une nouvelle colonne mais le problème est qu’elles sont noyées parmi des centaines d’autres informations. Scraping websites using the Scraper extension for Chrome. If you are using Google Chrome there is a browser extension for scraping web pages.
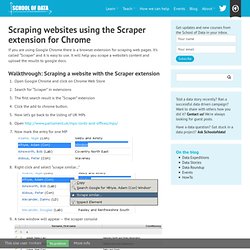
It’s called “Scraper” and it is easy to use. It will help you scrape a website’s content and upload the results to google docs. Walkthrough: Scraping a website with the Scraper extension Open Google Chrome and click on Chrome Web StoreSearch for “Scraper” in extensionsThe first search result is the “Scraper” extensionClick the add to chrome button.Now let’s go back to the listing of UK MPsOpen mark the entry for one MP Right click and select “scrape similar…” A new window will appear – the scraper console In the scraper console you will see the scraped contentClick on “Save to Google Docs…” to save the scraped content as a Google Spreadsheet. OpenIntro. Using Excel to do precision journalism, an Update from the School of Data Journalism in Perugia. Our first workshop has just kicked off with Steve Doig leading “Excel for Journalists”.
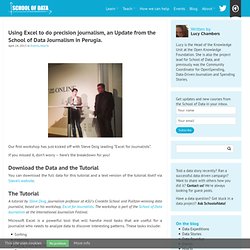
If you missed it, don’t worry – here’s the breakdown for you! Download the Data and the Tutorial You can download the full data for this tutorial and a text version of the tutorial itself via Steve’s website. The Tutorial. Créez une carte avec Google Maps et Fusion Table - NewsResources. Grabbing Twitter Search Results into Google Refine and Exporting Conversations into Gephi. Originally published by Tony Hirst on blog.ouseful.info under a Creative Commons Attribution licence.
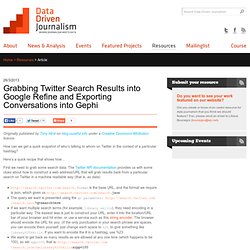
How can we get a quick snapshot of who’s talking to whom on Twitter in the context of a particular hashtag? Here’s a quick recipe that shows how… First we need to grab some search data. Google Earth en Hist Géo : Présentation. How to: Comment faire un Google Motion Chart. Google Motion Chart est un outil puissant et simple d'utilisation qui permet d'interroger facilement un grand nombre de points de données.

Voici en quelques étapes simples comment réaliser le sien. Faire parler des tableaux de données, c’est pas facile. On peut les décrire à la main, mais c’est long et fastidieux. On peut en faire des visualisations, mais ça coûte cher en design. Règles d'or (NYT) Rating: 4.5/5 (1 vote cast) The New York Times has one of the largest, most advanced graphics teams of any national newspaper in the world.

The NYT deputy graphics editor Matthew Ericson led a two-hour workshop at the International Journalism Festival last week about his team’s approach to visualising some of the data that flows through the paper’s stories everyday. Scraping for… by Paul Bradshaw. The Who, What, Where, Why, When and How of Infographics. Who, what, where, why, when and how are the fundamental questions that journalists are taught to ask when they collect information for a story.When you design and publish infographics, you in essence assume the role of a brand journalist. The following are some questions that can help you synthesize your ideas, taken from the book, The Power of Infographics: Using Pictures to Communicate and Connect with your Audiences, by Mark Smiciklas. Who • Who is the audience for your infographic? As you are distilling your thoughts, keep asking yourself who you are designing the infographic for.
The culture of the sector or the general persona of the individuals consuming your content will influencethe type of information you need to visualize or the tone of the infographic. The Data Journalism Handbook. How To Use Simple Excel Functions for Data Analysis. In this series of video tutorials, ICIJ reporter Kate Willson demonstrates four basic yet essential Excel functions to assist with data analysis during investigative reporting. Want to see any other video tutorials about Computer-Assisted Reporting? Please let us know either in the comments below or at contact@icij.org. Data Journalism (CAR)