
L'outil des achats responsables : des produits écologiques évalués par un cabinet expert. GreenIT.fr › Toute l'actualité du Green IT. Information de transparence cologique. Visualising sustainability « Computing for Sustainability. New (Dec 2011): “Sustainable Lens: A visual guide” published by NewSplash available through Amazon.
How to convey the essence of sustainability in a few sketched lines? I’m wading through the net and my bookshelves to find examples of the genre. I’m looking for schematics of the notion of sustainability itself rather than the underlying science – greenhouse, carbon, meso climate process, ground water, etc for which there are a zillion diagrams.
The list is not meant to be exhaustive, but if I’ve missed your favourite diagram, leave a link and I’ll add it to the list. Many of these images are duplicated all over the web, I’ve tried to find original sources (try tineye, is really cool), but again, let me know if I’ve missed something. In no particular order, here’s 100 125 137 158 179 188 218 255 of what I’ve found. 1. 2. This model is very very common (google search sustainability Venn). Venn diagrams coming together and showing changing dominance of sectors in a static animation. 3. 4. Thirty more sustainability diagrams « Computing for Sustainability. I’m working towards structuring the collection into a book (watch this space).
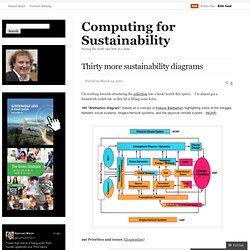
I’ve almost got a framework sorted out, so this lot is filling some holes. 189 “Bretherton diagram” (based on a concept of Francis Bretherton) highlighting some of the linkages between social systems, biogeochemical systems, and the physical climate system. (NCAR) 190 Priorities and issues (Gloustershire) 191 Capitalist system (IWW poster, see also) 192 Cause and effect diagram (Fishbone or Ishikawa diagram, instructions). 193 Road depends on where you start (Jo Johnston) 194 Realms (Baudot via Ford) 195 Global footprint versus Human Development Index (WWF via Oildrum) 196 Sequence of world systems 1949, 2007, 2030, 2050 (Charles Hall via Oildrum) 197 Node diagram (Isaksson and Steimle, img) 198 Human life project (young child version, also young adult and adult). 199 Cycles in Sustainable Economy (Carana). 200 Creating sustainable value framework (Hart and Milstein via Brinq) 201 360 model (Hollingworth) 212 Spaceship.
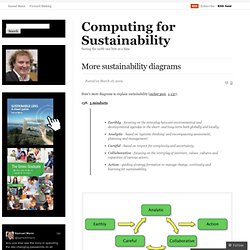
More sustainability diagrams « Computing for Sustainability. Here’s more diagrams to explain sustainability (earlier post, 1-137). 138. 5 mindsets Earthly - focusing on the interplay between environmental and developmental agendas in the short- and long-term both globally and locally;Analytic - based on ‘systems thinking’ and encompassing assessment, planning and management;Careful - based on respect for complexity and uncertainty;Collaborative - focusing on the interplay of interests, values, cultures and capacities of various actors;Action - guiding strategy formation to manage change, continuity and learning for sustainability. 139. 3 aspects mixed with a production cycle (Huhtamaki) 140.
Governance and sustainability (Aras and Crowther) 141. 142. 143. 144. 145. Global sustainability related to international business 147. 148. 149. 150.