
JS charts – The free JavaScript chart generator. Welcome to HDGraph ! — HDGraph. Visualizing Data with Flot - NETTUTS. Blog Archive » Canvas pie. UPDATE: Translation in Brazilian Portuguese here, thanks Maujor!
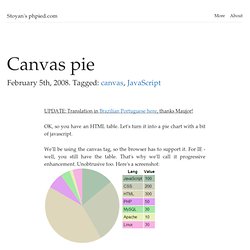
OK, so you have an HTML table. Let's turn it into a pie chart with a bit of javascript. We'll be using the canvas tag, so the browser has to support it. For IE - well, you still have the table. That's why we'll call it progressive enhancement.