

» Carbon Management in the Global Manufacturing Sector Pike Research. Manufacturing is the largest source of greenhouse gas (GHG) emissions.
In 2007, global manufacturing industries accounted for about 40% of total CO2 emissions. As a result, carbon management and reduction have become serious issues for manufacturers in practically every country around the world. To address the GHG emissions challenge, manufacturers are compelled to examine their supply chain for opportunities to manage carbon emissions effectively, all the way from sourcing and production, to distribution and product afterlife. It is impossible to understand the carbon footprint associated with manufacturing unless the entire supply chain is examined. As a result, there is a strong and growing need for assistance in putting programs in place to manage and reduce a manufacturer’s GHG emission. This Pike Research report examines carbon management from a manufacturing sector perspective, including trend analysis and market sizing and forecasts from 2008 through 2017. Who needs this report? Facts about China: MANUFACTURING & WORKFORCE.
China Mike’s 100% verified, no B.S.

China facts (interesting & fun statistics): China is expected to be the world’s biggest manufacturing nation in 2011, when it is expected to end the U.S.’s 110-year run as the number one country in factory production. In 2009, the U.S. created 19.9% of the world’s manufacturing output, compared to China’s 18.6%. [ IHS Global Insight, a US-based economics consultancy ]According to a 2008 National Geographic cover story “China: Inside the Dragon”: 70% of the world’s umbrellas are made in China. 60% of the world’s buttons are made in China. 9% of Chinese goods sent to the U.S. end up on Wal-Mart’s shelves. 72% of U.S. shoes were made in China. 85% of all U.S. artificial Christmas lights are made in China. 50% of U.S. kitchen appliances are made in China. 50% of U.S. toys are made in China.
2011 report reveals China manufacturing hourly labor rate, compensation costs impact EMS. China’s hourly manufacturing labor rates are far below rates in Japan ($27.80) and Taiwan ($8.68) but roughly on par with nations like the Philippines ($1.68).

China manufacturing compensation costs slightly higher than those in India. Many EMS / ODM companies in China, especially those making PCs, are moving operations inland. A 2011 report published by the U.S. Bureau of Labor Statistics (BLS) takes a thorough look at hourly manufacturing labor rates in China. While there has been a lot of demand for stats on China’s manufacturing sector, particularly comparable labor cost measurements, compiling accurate data has proven challenging for most analysts given China’s non-traditional practice of gathering and reporting the data is not typically recognized by research and analyst peers in the international community.
Given this difficulty, it can take years to compile a reasonably accurate profile for hourly labor rate information on China’s manufacturing sector. Chart 1 Chart 2 Table 1. IMF trims India’s growth rate to 7.5-7.75 percent in 2011-12. Washington: Slowing investments and sluggish global recovery have forced the International Monetary Fund (IMF) to scale down India's economic growth rate to 7.5-7.75 percent this fiscal from 8.5 percent in 2010-11. "In India, growth is forecast to average 7.5 to 7.75 percent during 2011–12. Activity is expected to be led by private consumption," IMF said in its World Economic Outlook. The report was released ahead of the annual meetings of the IMF and the World Bank which, among others, will be attended by Indian Finance Minister Pranab Mukherjee. Investment, according to the Outlook, "is expected to remain sluggish, reflecting, in part, recent corporate sector governance issues and a drag from the renewed global uncertainty and less favourable external financing environment".
IMF said that controlling inflation continues to remain a major challenge for India and added that despite a series of rate hikes by the Reserve Bank of India, credit growth still remains strong. China GDP Growth Rate at 2.20 percent. India GDP Growth Rate at 7.70 percent. GDP Growth Rate | NotesThe GDP Growth Rate shows a percentage change in the seasonally adjusted GDP value in the certain quarter, compared to the previous quarter.
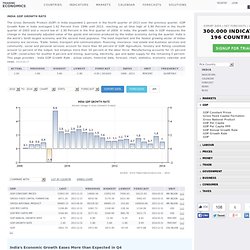
Because of climatic conditions and holidays, the intensity of the production varies throughout the year. This makes a direct comparison of two consecutive quarters difficult. In order to adjust for these conditions, many countries calculate the quarterly GDP using so called seasonally adjusted method. Lists of countries by GDP. Economy of India. The independence-era Indian economy (from 1947 to 1991) was based on a mixed economy combining features of capitalism and socialism, resulting in an inward-looking, interventionist policies and import-substituting economy that failed to take advantage of the post-war expansion of trade.[22] This model contributed to widespread inefficiencies and corruption, and the failings of this system were due largely to its poor implementation.[22] In 1991, India adopted liberal and free-market principles and liberalised its economy to international trade under the guidance of Former Finance minister Manmohan Singh under the Prime Ministrship of P.V.Narasimha Rao, who had eliminated Licence Raj, a pre- and post-British era mechanism of strict government controls on setting up new industry.
Overview[edit] The combination of protectionist, import-substitution, and Fabian social democratic-inspired policies governed India for sometime after the end of British occupation. History[edit] List of countries by GDP sector composition. This is a list of countries by Gross Domestic Product (GDP) sector composition.
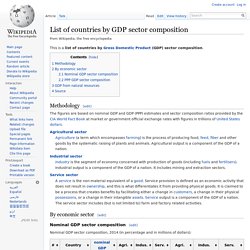
Methodology[edit] The figures are based on nominal GDP and GDP (PPP) estimates and sector composition ratios provided by the CIA World Fact Book at market or government official exchange rates with figures in trillions of United States dollars. Top 15 Manufacturing Countries in 2009 at Curious Cat Investing and Economics Blog. China continues to grow manufacturing is output.
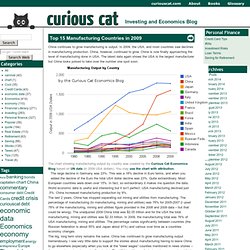
In 2009, the USA, and most countries saw declines in manufacturing production. China, however, continued to grow. China is now finally approaching the level of manufacturing done in USA. The latest data again shows the USA is the largest manufacturer but China looks poised to take over the number one spot soon. The chart showing manufacturing output by country was created by the Curious Cat Economics Blog based on UN data (in 2009 USA dollars). The large decline in Germany was 23%. Comprehensive National Power. There is a general consensus that the United States is the nation with the highest CNP and that mainland China's CNP ranks not only far behind the United States but also behind the United Kingdom, Russia, France and Germany.
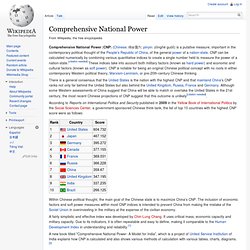
Although some Western assessments of China suggest that China will be able to match or overtake the United States in the 21st century, the most recent Chinese projections of CNP suggest that this outcome is unlikely[citation needed]. According to Reports on International Politics and Security published in 2009 in the Yellow Book of International Politics by the Social Sciences Center, a government-sponsored Chinese think-tank, the list of top 10 countries with the highest CNP score were as follows: Within Chinese political thought, the main goal of the Chinese state is to maximize China's CNP. A fairly simplistic and effective index was developed by Chin-Lung Chang. It uses critical mass, economic capacity and military capacity. See also[edit] References[edit]
Country Rankings 2011 - Country comparisons, Economy, Geography, Climate, Natural Resources, Current Issues, International Agreements, Population, Social Statistics, Flags, Maps, Political System. NON-CIA RANKS NOTE: The rankings in this catecory, "NON-CIA RANKS", are not derived from the current world fact book.

Consequently some are not based on current data. GDP Gross Domestic Product Projections 2000, 2010, 2020, 2030, 2040, geographic.org Courty Profiles - Economy, Geography, Climate, Natural Resources, Current Issues, International Agreements, Population, Social Statistics, Political System, Flags, Maps. What are the Top Manufacturing Countries? Economy of the People's Republic of China. China (3,650 $) Higher GNI per capita compared to China Lower GNI per capita compared to China.
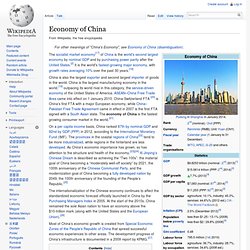
Historical GDP of the People's Republic of China. This article includes a list of China's historical gross domestic product (GDP) values, the market value of all final goods and services produced by a nation in a given year. The GDP dollar estimates presented here are either calculated at market or government official exchange rates (nominal), or derived from purchasing power parity (PPP) calculations.
This article also includes historical GDP growth. List of countries by GDP (PPP) Countries by share of world GDP, on a purchasing power parity (PPP) basis. This article includes three lists of countries of the world sorted by their gross domestic product (GDP; the value of all final goods and services produced within a state in a given year). The GDP dollar estimates given on this page are derived from purchasing power parity (PPP) calculations. Using a PPP basis is arguably more useful when comparing generalized differences in total economic output between countries because PPP takes into account the relative costs and the inflation rates of the countries, rather than using just exchange rates which may distort the real differences in income.
The first table includes data for the year 2013 for 182 of the current 187 International Monetary Fund (IMF) members and Taiwan (the official list uses "Taiwan, Province of China"). Manufacturing. Textile factory (Germany, about 1975). Manufacturing is the production of merchandise for use or sale using labour and machines, tools, chemical and biological processing, or formulation. The term may refer to a range of human activity, from handicraft to high tech, but is most commonly applied to industrial production, in which raw materials are transformed into finished goods on a large scale. Such finished goods may be used for manufacturing other, more complex products, such as aircraft, household appliances or automobiles, or sold to wholesalers, who in turn sell them to retailers, who then sell them to end users – the "consumers". The manufacturing sector is closely connected with engineering and industrial design.
Corporate governance, reforms, CEO/CFO certification, Sarbanes-Oxley, internal controls, compliance, risk services, Toronto, July 6, 2005 – The ongoing corporate governance requirements both in Canada and the U.S. have generated public debate in relation to the mounting costs that companies are forced to incur during the compliance and certification process. However, Deloitte demonstrates how it is possible for Canadian companies to turn the ‘sunken cost’ of compliance into real business advantage through maximizing business benefits beyond compliance. Based on its experience in assisting more than 800 North American companies address the new corporate governance and CEO/CFO certification requirements, Deloitte has found that compliance need not be a lost cost.
Instead, Canadian companies embracing corporate governance will ultimately be rewarded by the market. Global Benchmark Study - Supply Chain - Manufacturing - Trends - Reduce Cost - Innovation. This report, "The Challenge of Complexity in Global Manufacturing: Trends in Supply Chain Management," is the first part of Deloitte's global benchmark study of supply chain trends and issues. Here, we examine how intense pressure to reduce costs, innovate products and expand into new markets has manufacturing companies worldwide shifting production and spreading out supply chain and other operations well beyond their home geography.
New Directions in Manufacturing: Report of a Workshop. Welcome to Manufacturing News. Consistent Characteristics of Competitive Manufacturers. Earlier this week, President Obama sat down with more than 150 CEOs at the Business Roundtable. The topic: Competitiveness. The president's comments: We need to nurture the industries of the future. I think most of us would agree with this sentiment. So the real question is: What exactly do competitive industries look like -- and what specifically do we need to nurture? At Deloitte, we are looking at this very question. While we won't have the final survey results until the spring, and more CEOs are responding each day, our work has already revealed findings that should cause us all to pause, take stock, and formulate a new path forward.