
Multiple versions of Chrome. Why Garbage Collection? Chapter 9 of Inside the Java Virtual MachineGarbage Collectionby Bill Venners The Java virtual machine's heap stores all objects created by a running Java application.

Objects are created by the new, newarray, anewarray, and multianewarray instructions, but never freed explicitly by the code. Garbage collection is the process of automatically freeing objects that are no longer referenced by the program. This chapter does not describe an official Java garbage-collected heap, because none exists. As mentioned in earlier chapters, the Java virtual machine specification does not require any particular garbage collection technique. Accompanying this chapter on the CD-ROM is an applet that interactively illustrates the material presented in the chapter. The name "garbage collection" implies that objects no longer needed by the program are "garbage" and can be thrown away. In addition to freeing unreferenced objects, a garbage collector may also combat heap fragmentation. Figure 9-1. Garbage Collection. Chrome Developer Tools. Command Line API. From FirebugWiki The Firebug Command Line provides these special functions for your convenience.
These include functions to control the Firebug UI, functions interacting with the page, shortcuts for selectors and shortcuts for the Console API. Other browsers implement the Command Line API as well; the Chrome DevTools, Safari Inspector and Opera Dragonfly, implement most of what is below. [edit] help Returns a list of Command Line API commands including short descriptions. [edit] $(selector) Returns a single element matching the given CSS selector.
In old Firebug versions, this used to be equivalent to document.getElementById. [edit] $$(selector) Returns an array of elements that match the given CSS selector. [edit] $x(xpath[, contextNode[, resultType] ]) Returns an array of elements that match the given XPath expression. [edit] $0 Represents the last element selected via the Inspector. [edit] $1 Represents the second last element selected via the Inspector. [edit] $_ WebKit’s JavaScript Profiler Explained. The trend toward rich client-side web applications has brought with it a need for robust JavaScript development tools.

Firebug lead the way in this arena, but WebKit’s Web Inspector has caught up in a big way and ships with all recent versions of Safari and Chrome. One powerful tool inside Web Inspector that is likely under utilized is the Profiles pane. I write a lot of client-side JavaScript and it still took me a long time to work up the gusto to dig into this tool and get anything out of it.
If you find yourself in the position I was in, hopefully this post will give you what you need to get up and running quickly. Basics The JavaScript profiler is used to find and alleviate CPU bottlenecks in your code. There are two ways to run a profile: 1) Manually The pane itself has a little button in the lower left-hand corner which can be used to start and stop a profile. 2) Programmatically The way I suggest you invoke profile runs is by calling into the console directly from your code.
Focus. Understanding Heap Profiler. Google Chrome's Heap Profiler and Memory Timeline. (with thanks to Mikhail Naganov for his feedback on the Developer Tools mailing list) Chrome’s Developer Tools contain some useful features for inspecting memory usage of a given page (and its change over time), but the documentation for these features is a bit sparse—and, if you are unfamiliar with these sorts of tools and what they do, their output can seem undecipherable.
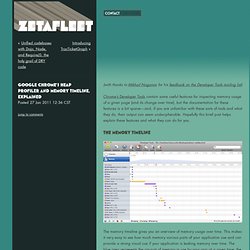
Hopefully this brief post helps explain these features and what they can do for you. The Memory Timeline The memory timeline gives you an overview of memory usage over time. This makes it very easy to see how much memory various parts of your application use and can provide a strong visual cue if your application is leaking memory over time. The Heap Profiler The heap profiler is a somewhat more complicated tool than the memory timeline: while the memory timeline shows you how much memory is in use over time, the heap profiler gives you an overview of all of the objects in memory at the moment the snapshot was taken.
12 Tricks to Develop Quicker.