
Jan Willem Croon / Pinterest. Transparency. Gizmos Freeware Reviews. TagCrowd: make your own tag cloud from any text. How To > Visual Thinking. S Werelds beste manier om strips te maken en delen. Jilster - samen een mooi tijdschrift maken. The Best Tools for Visualization. Visualization is a technique to graphically represent sets of data.

When data is large or abstract, visualization can help make the data easier to read or understand. There are visualization tools for search, music, networks, online communities, and almost anything else you can think of. Whether you want a desktop application or a web-based tool, there are many specific tools are available on the web that let you visualize all kinds of data. Here are some of the best: Visualize Social Networks Last.Forward: Thanks to Last.fm's new widget gallery, you can now explore a wide selection of extras to extend your Last.fm experience. Last Forward Friends Sociomap: Friends Sociomap is another Last.fm tools that generates a map of the music compatibility between you and your Last.fm friends. Fidg't: Fidg't is a desktop application that gives you a way to view your networks tagging habits.
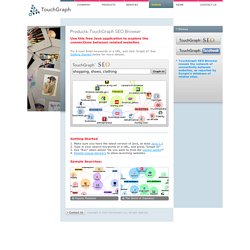
Fidg't The Digg Tools: One more: Digg Radar. YouTube: Visualize Music Musicovery Last.fm music visual tools: Amazon. SEO Keyword Graph Visualization. Use this free Java application to explore the connections between related websites.

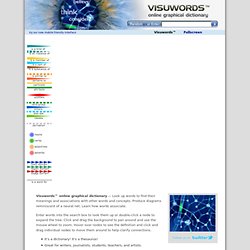
Try it now! Enter keywords or a URL, and click 'Graph it! ' See Getting Started below for more details. Getting Started Make sure you have the latest version of java, at least Java 1.5 Type in your search keywords or a URL, and press "Graph It! " Sample Searches: Synoniemen.net. Visual Thesaurus. Online graphical dictionary and thesaurus. Visuwords™ online graphical dictionary — Look up words to find their meanings and associations with other words and concepts.

Produce diagrams reminiscent of a neural net. Learn how words associate. Enter words into the search box to look them up or double-click a node to expand the tree. Click and drag the background to pan around and use the mouse wheel to zoom. Hover over nodes to see the definition and click and drag individual nodes to move them around to help clarify connections. It's a dictionary!
Visuwords™ uses Princeton University’s WordNet, an opensource database built by University students and language researchers. The Visuwords™ Interface To use the applet you only need to type a word into the search query at the top of the page and press 'Enter'. You can zoom the model in and out by rolling the wheel on your mouse. Understanding the links between Synsets.
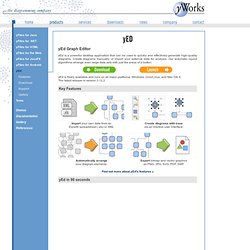
Wordl cloud. V.U.E. yEd - Graph Editor. yEd is a powerful desktop application that can be used to quickly and effectively generate high-quality diagrams.

Create diagrams manually, or import your external data for analysis. Our automatic layout algorithms arrange even large data sets with just the press of a button. yEd is freely available and runs on all major platforms: Windows, Unix/Linux, and Mac OS X. The latest release is version 3.12.2 Key Features Import your own data from an Excel® spreadsheet (.xls) or XML Create diagrams with easevia an intuitive user interface. Automatically arrangeyour diagram elements. Export bitmap and vector graphicsas PNG, JPG, SVG, PDF, SWF yEd in 90 seconds Supported Diagrams yEd supports a wide variety of diagram types.
Support Resources The yEd online support resources include the yEd Graph Editor manual and the yEd forum where you can give us feedback. Gapminder.org. Prezi. Google Apps. SpicyNodes. iSketch. Learn.