
Data Mining. Countries where no one lives in the city. Tools. Andrew cooke: military spending. Please download these two images. they were made using freely available data and tools - i've included a description of the technique, scripts and data files that you can use as the basis for further work. note - someone drew my attention to the fact that russia does not appear on this map!
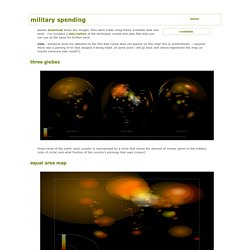
This is unintentional - i assume there was a parsing error that stopped it being listed. at some point i will go back and check/regenerate the map (or maybe someone else could?!).
DBpedia. 20 Big Data Repositories You Should Check Out. Control of Data Collection. Gapminder: Unveiling the beauty of statistics for a fact based world view. Our World in Data. Data Collection | Data Analysis | Data Transformation. I love live data visualizations. Here's every one that I know about. : dataisbeautiful. The Wisdom Academy - Global Vital Stats.
Worldometers - real time world statistics. Numbeo - The biggest Internet Database about Cost of Living, Housing Indicators and many other informations about cities and countries! Numbeo is the world’s largest database of user contributed data about cities and countries worldwide.
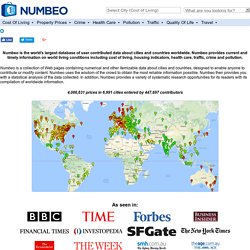
Numbeo provides current and timely information on world living conditions including cost of living, housing indicators, health care, traffic, crime and pollution.
14 Reliable Data Sources for Creating Infographics. Visual messages are interpreted faster than textual ones at a mind-blowing rate of 60,000 times faster.

Hence, infographics have quickly become a popular method for presenting detailed data. While infographics are beautiful and efficient, they hold a strong responsibility of providing accurate data. To assist designers in digging up reliable data, we listed some of our go-to sites for information. Data.gov This is a great resource to start off with as it covers a variety of topics, including agriculture, climate, education, energy, and science and research. Global Consciousness Project. Un article de Wikipédia, l'encyclopédie libre.

Big Data. Services like social networks, web analytics, and intelligent e-commerce often need to manage data at a scale too big for a traditional database.

As scale and demand increase, so does Complexity. Fortunately, scalability and simplicity are not mutually exclusiverather than using some trendy technology, a different approach is needed. #BigData : Dataiku lève 3 millions d'euros pour conquérir le monde. Dataiku, une jeune pousse qui se positionne déjà comme un acteur majeur sur le marché du Big Data, vient d’annoncer une première levée de fonds de 3 millions d’euros.
Un tour de table réalisé auprès d’Alven et Serena Capital pour accélérer sa croissance et développer son logiciel Data Science Studio à l’international. Dataiku est une startup parisienne, créée en 2013 par Florian Douetteau, Marc Batty, Clément Sténac et Thomas Cabrol, qui a lancé son premier logiciel, Data Science Studio, en février 2014. Une plate-forme facilitant et accélérant l’analyse de données et la création d’applications business et prédictives en environnement Big Data et qui a déjà séduit une vingtaine d’entreprises au cours de ces derniers mois (Chronopost, par exemple, utilise les services de la startup pour l’optimisation de la livraison de colis).
Big data with farmers. To feed the world's rapidly-expanding population in the coming decades, agriculture must produce more.
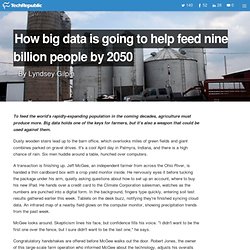
Big data holds one of the keys for farmers, but it's also a weapon that could be used against them. Dusty wooden stairs lead up to the barn office, which overlooks miles of green fields and giant combines parked on gravel drives. It's a cool April day in Palmyra, Indiana, and there is a high chance of rain. Six men huddle around a table, hunched over computers. A transaction is finishing up. McGee looks around. Les nouveaux terrains de jeu du Big Data. Big Data : pourquoi nos métadonnées sont-elles plus personnelles que nos empreintes digitales.
La métamorphose du Data Center : quelles perspectives pour le futur ? Le 27 mai dernier, Bull organisait avec 01 Informatique un séminaire dédié aux infrastructures au cours duquel intervenaient plusieurs de ses grands partenaires ( EMC, Intel, VMwareet Schneider Electric) et des DSI de ses grands clients.

Open Data : la Commission Européenne ouvre son portail en bêta. Big data : le diagnostic psychologique par les réseaux sociaux. L’analyse des médias sociaux peut-elle permettre de diagnostiquer certaines pathologies psychologiques comme le stress, la dépression, le burn-out et les troubles bipolaires ?
Des chercheurs de l’Université Johns-Hopkins répondent par l’affirmative. Après avoir exploité des tweets pour repérer des cas de grippe en 2013, ils ont amélioré leur algorithme pour étudier les publications de twittos ayant déclaré leur maladie… et pour décortiquer les éléments de langage liés à ces troubles. Leurs techniques de « data mining » explorent des mots et des expressions bien particuliers pour les rattacher à des comportements. Par exemple, « Je ne veux pas sortir du lit » en relation avec l’anxiété ou l’insomnie. L’examen de 8 milliards de tweets leur a permis de créer une large base de connaissance allant des troubles affectifs au stress post-traumatique. Les données nous rendent-elles plus responsables ? Les Américains mangent en moyenne trois hamburgers par semaine.

Cela fait 156 hamburgers par personne, chaque année. Combien coûte à l’environnement une telle consommation ? C’est ce que le Center for Investigate Reporting a calculé, avec une cascade de chiffres impressionnants… et des unités de mesure plutôt inattendues. > Des données pour révéler les coûts cachés Par exemple, saviez-vous qu’il faut plus de 18 000 litres d’eau pour produire un seul kilo de viande de bœuf ? Where Industry Discovers Geospatial Image Analysis. Louisville, home of the Kentucky Derby, great food, and this year's 2014 ASPRS annual conference. Held at the Galt House hotel, this year's conference offered a great mix of all things remote sensing over a three-day agenda.
It was also co-located with a Joint Agency for Commercial Imagery Evaluation(JACIE) conference, which created a nice atmosphere where some of the best and brightest minds from science and academia could meet. Eyes in the Skies One of the most apparent trends I noticed at this show was the amount of exhibitors that had something to do with Unmanned Aerial Systems,or UAS. With the pending approval for UAS to fly commercially, many folks are beginning to offer services surrounding these sensors. Find Data.
Data Access Tools. Interactive Internet Data Tools Data Visualization Gallery - A weekly exploration of Census data used to promote visualization and make data accessible to a broader audience.2010 Census Interactive Population Map - Use this tool to explore 2010 Census statistics down to the block level, compare your community with others, and embed charts on your web site.The American FactFinder - This interactive application provides statistics from the Economic Census, the American Community Survey, and the 2010 Census, among others.QuickFacts - State and County QuickFacts provides frequently requested Census Bureau information at the national, state, county, and city level.Easy Stats - quick and easy access to selected statistics collected by the U.S.
Research Data Centers Software to Download Direct File Access Access Tools at Other Sites Integrated Public Use Microdata Series - iPUMS [University of Minnesota].
Cleaning/preparing data. Working with Qualitative data. Tool Collections. Other Tools. Get Help. Worldometers - real time world statistics. Refine - Google Refine, a power tool for working with messy data (formerly Freebase Gridworks) OpenRefine. Researchers Harness Brain Game Data. The activities of cognitive training enthusiasts give insight into the effects of lifestyle choices and age on the brain’s performance. FLICKR, HEY PAUL STUDIOSScientists from California’s Lumos Labs, maker of Web-based brain training games, are gathering data from online users to make connections between cognitive performance, lifestyle choices, and aging, according to a paper published last week (June 20) in Frontiers in Human Neuroscience.
For tasks testing memory and arithmetic skills—each completed by around 127,000 to 162,000 users who took a lifestyle survey—the researchers found that high performance correlated with drinking one or two alcoholic beverages per day and sleeping around 7 hours a night. Socrata. "Send me your data - PDF is fine," said no one ever (how to share your data effectively) - Caitlin Rivers. Partners with Nature on their Scientific Data journal. Worldwide urban population - Google Fusion Tables. SHOW®/WORLD - A New Way To Look At The World. InfoVis CyberInfrastructure- Latent Semantic Analysis. Software > Latent Semantic Analysis Description | Pros and Cons | Applications | Details | Usage Hints | References | Acknowledgments Latent Semantic Analysis (LSA) can be applied to induce and represent aspects of the meaning of words (Berry et al., 1995; Deerwester et al., 1990; Landauer & Dumais, 1997; Landauer et al.,1998).
StatCrunch - Data analysis on the Web. GeoNames. Public Data Explorer. Indicateurs de développement humain Rapport sur le développement humain 2013, Programme des Nations Unies pour le développement Les données utilisées pour calculer l'Indice de développement humain (IDH) et autres indices composites présentés dans le Rapport sur le développement humain ...
Eurostat, Indicateurs démographiques. OpenStreetMap. Home. Data.gov (US) World Statistics, Country Comparisons. Open Data Portal (UE) Ckan - The open source data portal software. Data.gov (uk) Build your own databases Easily : Zoho Creator. Wikidata. Worldometers-Real time Amazing World Stats. Databases & Linked Data. Data.gouv.fr. TradingEconomics.com - Indicators for 196 Countries.