
VisualVM. Java Memory Profiler. About JMP is a profiler for java that can be used to trace objects usage and method timings.
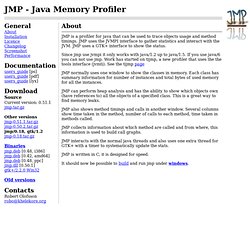
JMP uses the JVMPI interface to gather statistics and interact with the JVM. JMP uses a GTK+ interface to show the status. Faces Trace. Quick tour of TPTP. Look inside with TPTP Save time, aggravation, and breakdowns: hone your applications with the TPTP test, trace and monitoring tools.
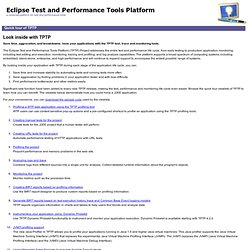
The Eclipse Test and Performance Tools Platform (TPTP) Project addresses the entire test and performance life cycle, from early testing to production application monitoring, including test editing and execution, monitoring, tracing and profiling, and log analysis capabilities. The platform supports a broad spectrum of computing systems including embedded, stand-alone, enterprise, and high-performance and will continue to expand support to encompass the widest possible range of systems. By looking inside your application with TPTP during each stage of the application life cycle, you can: Save time and increase stability by automating tests and running tests more often Save aggravation by finding problems in your application faster and with less difficulty Find performance bottlenecks and other metrics easily.