
Untitled. Data is beautiful, data is a story. Packages. Using R to quickly create an interactive online map using the leafletR package. The Molecular Ecologist. First off, thanks to Tim and Jeremy for the invitation to write a guest post here on using R to make maps!
As a brief introduction, my name is Kim Gilbert, and I am a Ph.D. student at the University of British Columbia working with Mike Whitlock. I am broadly interested in population genetics and population structure, and am currently studying local adaptation in a tree species. If you want to know more, check out my website, where I also have this tutorial as a .pdf presentation. Okay, onward with R! And apologies in advance that the R code provided will not show color coded text (a limitation of wordpress), but I decided that it is more useful to leave as text in order to allow copying and pasting rather than insert screenshots that might look nicer but require retyping on your part.
Packages. Data Science - Community. Web Technologies and Services. Data Sets. Index of /ml/machine-learning-databases. Publishable Stuff. DataRemixed. VizWiz - Data Visualization Done Right. Visual Business Intelligence. VC blog. Posted: November 26th, 2014 | Author: Manuel Lima | Filed under: Uncategorized | No Comments » As some attentive users of Visual Complexity might have noticed, the number of projects featured on the website has slowly come to a halt, with the perpetual grand total of 777 being a grieving reminder of inactivity for well over a year.
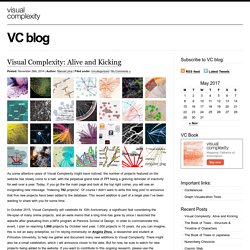
Today, If you go the the main page and look at the top right corner, you will see an invigorating new message: “Indexing 782 projects”. Of course I didn’t want to write this blog post to announce that five new projects have been added to the database. Information aesthetics - Data Visualization & Information Design. Principal Component Analysis step by step.
In this article I want to explain how a Principal Component Analysis (PCA) works by implementing it in Python step by step.
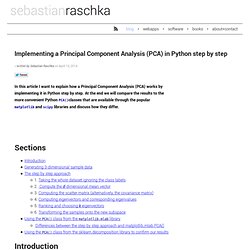
At the end we will compare the results to the more convenient Python PCA()classes that are available through the popular matplotlib and scipy libraries and discuss how they differ. Data Visualization, Infographics, and Statistics. Tools on Datavisualization. A Carefully Selected List of Recommended Tools 07 May 2012 Tools Flash, JavaScript, Processing, R When I meet with people and talk about our work, I get asked a lot what technology we use to create interactive and dynamic data visualizations.
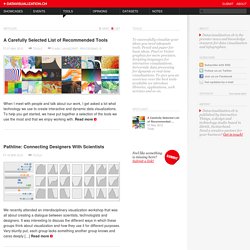
To help you get started, we have put together a selection of the tools we use the most and that we enjoy working with. Read more Pathline: Connecting Designers With Scientists 18 Apr 2012 Tools We recently attended an interdisciplinary visualization workshop that was all about creating a dialogue between scientists, technologists and designers. New Maps for the Web by Stamen 22 Mar 2012 Tools JavaScript, Mapping I just left the Stamen studio where I had a brief chat with founder and CEO Eric Rodenbeck.
The Visualizing Player 19 Jul 2011 Showcases, Tools Visualizing.org launched their brand new Visualizing Player, a terrific tool for embedding interactive and static data visualizations. A job board for people and companies looking to hire R users. Statistics with R, and open source stuff (software, data, community) A Quick-R Companion. R for Public Health. DiffusePrioR. Blog. An introductory comparison of using the two languages.
Background R was made especially for data analysis and graphics. SQL was made especially for databases. They are allies. Error Statistics Philosophy. Machine Learning (Theory) Data Mining: Text Mining, Visualization and Social Media. The Turing Test for artificial intelligence is a reasonably well understood idea: if, through a written form of communication, a machine can convince a human that it too is a human, then it passes the test.
The elegance of this approach (which I believe is its primary attraction) is that it avoids any troublesome definition of intelligence and appeals to an innate ability in humans to detect entities which are not 'one of us'. This form of AI is the one that is generally presented in entertainment (films, novels, etc.). However, to an engineer, there are some problems with this as the accepted popular idea of artificial intelligence. I believe that software engineering can be evaluated in a simple measure of productivity. Hilarymason.com. Big Data, Plainly Spoken (aka Numbers Rule Your World) Two years ago, Wired breathlessly extolled the virtues of A/B testing (link).
A lot of Web companies are in the forefront of running hundreds or thousands of tests daily. The reality is that most A/B tests fail. A/B tests fail for many reasons. Typically, business leaders consider a test to have failed when the analysis fails to support their hypothesis. "We ran all these tests varying the color of the buttons, and nothing significant ever surfaced, and it was all a waste of time!
" Bad outcome isn't the primary reason for A/B test failure. 1. 2. 3. These issues are often ignored or dismissed. The Facebook Data Science team just launched an open platform for running online experiments, called PlanOut. Statisfaction. Statisfaction. Doing Bayesian Data Analysis. Three-Toed Sloth. "Learning Spatio-Temporal Dynamics" : Boasting about my student's just-completed doctoral dissertation. Over 2500 words extolling new statistical methods, plus mathematical symbols and ugly computer graphics, without any actual mathematical content, or even enough detail to let others in the field judge the results.
On Monday, my student Georg M. Blog. Old tails: a crude power law fit on ebook sales We use R to take a very brief look at the distribution of e-book sales on Amazon.com.

Read more… You don’t need to understand pointers to program using R. Access to Statistics. An Academic Blogging Experiment. Bayesianbiologist.