
Deep Learning with Emojis (not Math) – tech-at-instacart. 5 algorithms to train a neural network. By Alberto Quesada, Artelnics.

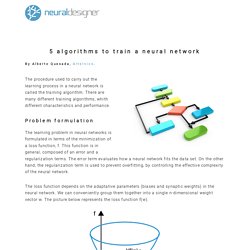
The procedure used to carry out the learning process in a neural network is called the training algorithm. There are many different training algorithms, whith different characteristics and performance. Problem formulation The learning problem in neural networks is formulated in terms of the minimization of a loss function, f. This function is in general, composed of an error and a regularization terms. The loss function depends on the adaptative parameters (biases and synaptic weights) in the neural network. As we can see in the previous picture, the point w* is minima of the loss function. ᐁif(w) = df/dwi (i = 1,... Similarly, the second derivatives of the loss function can be grouped in the Hessian matrix, Hi,jf(w) = d2f/dwi·dwj (i,j = 1,...
The problem of minimizing continuous and differentiable functions of many variables has been widely studied. One-dimensional optimization The points η1 and η2 define an interval that contains the minimum of f, η*. 1. 2. 3. Posts with «deep learning» label. Table of contents: This is the second post in a series on word embeddings and representation learning.

In the previous post, we gave an overview of word embedding models and introduced the classic neural language model by Bengio et al. (2003), the C&W model by Collobert and Weston (2008), and the word2vec model by Mikolov et al. (2013). We observed that mitigating the complexity of computing the final softmax layer has been one of the main challenges in devising better word embedding models, a commonality with machine translation (MT) (Jean et al. [10]) and language modelling (Jozefowicz et al. [6]).
In this post, we will thus focus on giving an overview of various approximations to the softmax layer that have been proposed over the last years, some of which have so far only been employed in the context of language modelling or MT. We will postpone the discussion of additional hyperparameters to the subsequent post. where \(h\) is the output vector of the penultimate network layer. ROC Analysis - ML Wiki. ROC Analysis ROC stands for Receiver Operating Characteristic (from Signal Detection Theory) initially - for distinguishing noise from not noise so it's a way of showing the performance of Binary Classifiers only two classes - noise vs not noise it's created by plotting the fraction of True Positives vs the fraction of False Positives True Positive Rate, tpr=TPTP+FN (sometimes called "sensitivity" or "recall") False Positive Rate fpr=FPFP+TN (also Fall-Out) see Evaluation of Binary Classifiers Evaluation of Binary Classifiers precision and recall are popular metrics to evaluate the quality of a classification system ROC Curves can be used to evaluate the tradeoff between true- and false-positive rates of classification algorithms Properties: ROC Curves are insensitive to class distribution If the proportion of positive to negative instances changes, the ROC Curve will not change ROC Space When evaluating a binary classifier, we often use a Confusion Matrix ROC Space Baseline Baseline Property.

ROC curve demonstration. There are lots of applications to machine learning, and the most popular problem in practice is binary classification.

Examples of things we want to predict: user will click / buy something or not page is appropriate to request or not charge of particle is positive or negative observed signal decay or something else bright object on the sky is galaxy or quasar There are many different area-specific metrics to estimate quality of classification, however the basic tool one should be able to work with regardless of the area is ROC curve (which I will talk about in this post). Notions in binary classification for binary predictions, is/as notation We have two classes: class 0 and class 1, background and signal respectively. Unfortunately, there are too many terms used to describe this (trivial) classification result. Let me introduce my own notion, more systematic (%picture about 15 standards%): Hardly one can misunderstand what each of introduced numbers means.
Other typically used measures: