
The Dataviz Pioneer You've Never Heard of. The most important person in the history of newspaper data visualization is a man you’ve never heard of.
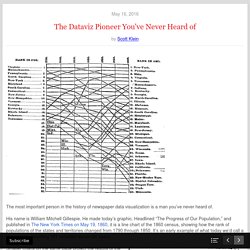
His name is William Mitchell Gillespie. He made today’s graphic. Headlined “The Progress of Our Population,” and published in The New York Times on May 19, 1860, it is a line chart of the 1860 census, showing how the rank of populations of the states and territories changed from 1790 through 1850. It’s an early example of what today we’d call a slopegraph, encoding 181 variables across 60 years. Smaller charts on the same page project the results of the unfinished 1860 census, and explore the demographic changes that marked the enormous growth of the country in the mid-19th century. If anything in mid-19th century newspaper graphics can be called "common," it's Gillespie's credit line. While Gillespie wasn’t quite obscure, he’s a hard man to research.
He was born in New York City in 1816 and died there on New Year’s Day in 1868. For now, our missing link is still not quite connected. 100yrs of Data Visualisation best practice. Visual thinking. Co-creation for quality - Orange Innovation. Co-creation, user participation, crowdsourcing and user driven innovation is on everybody’s lips.
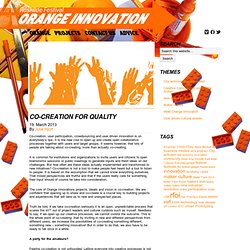
It is the new cool to open up and create open collaborative processes together with users and target groups. It seems however, that lots of people are talking about co-creating, more than actually co-creating. It is common for institutions and organizations to invite users and citizens to open brainstorms sessions or public meetings to generate inputs and fresh ideas on old challenges. But how often are these ideas actually implemented and transformed to new initiatives? Co-creation is not a tool to make people feel heard but a tool to listen to people. The core of Orange Innovations projects, ideals and vision is co-creation.
Truth be told, if we take co-creation seriously it is an open, unpredictable process that scares the sh** out of project leaders and cultural curators such as myself. A party for the amateurs? Fearing co-creation is not unfounded. Download the Pdf here. Morphology of Co-Creation. 1.
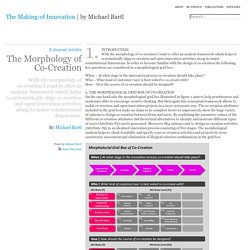
INTRODUCTION With the morphology of co-creation I want to offer an analysis framework which helps to systematically align co-creation and open innovation activities along its major constitutional dimensions. In order to become familiar with the design of co-creation the following key questions are considered in a morphological grid box: When – At what stage in the innovation process co-creation should take place? Who – What kind of customer/user is best suited to co-create with? How – How the course of co-creation should be designed? 2. Figure 1: The morphological grid box of co-creation 3. 4. Visualization tools for service design. Diagrams. How To > Visual Thinking.