
Predator Prey Simulation with Notecards. Name:___________________________________________ Objective: Students will simulate predator prey interactions using cards.
The number of predator and prey in their “ecosystem” will be recorded and graphed which will show a predator prey cycle in an ecosystem. Materials (Prepared in advance) Each group will receive 200 small squares cut from index cards (approximately 1 inch squared) -- The small squares represent the prey population. Each group will receive 50 large squares cut from index cards (cut index cards in half) -- The large squares represent the predator population. Each group will receive a data table (prepared) and blank graph paper to graph the data. *It is possible to substitute other materials to represent prey and predators, such as beans, paper plates, foam squares, pennies..etc* Your lab table or desk will represent your ecosystem (Please clear all objects, such as purses and backpacks) Simulate an Oil Spill Cleanup. 1.
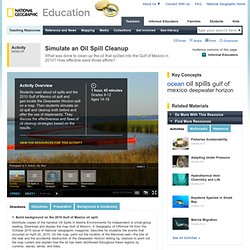
Build background on the 2010 Gulf of Mexico oil spill. Distribute copies of the handout Oil Spills in Marine Environments for independent or small-group reading. Download and display the map Gulf of Mexico: A Geography of Offshore Oil from the October 2010 issue of National Geographic magazine. Describe for students the events that occurred on April 20, 2010. Ecological Relationships. Lab Report Template. Title: * a brief, concise, yet descriptive title Statement of the Problem: * What question(s) are you trying to answer?

* Include any preliminary observations or background information about the subject Hypothesis: * Write a possible solution for the problem. * Make sure this possible solution is a complete sentence. * Make sure the statement is testable, an if-then statement is recommended to illustrate what criteria will support your hypothesis (and what data would no support the hypothesis). Scientific Method in Action. Scientific Method Experiments. Students in science classes often start off the first chapter with that familiar step-by-step flow chart showing how scientists develop a hypothesis, test a hypothesis, gather data, and then draw conclusions.
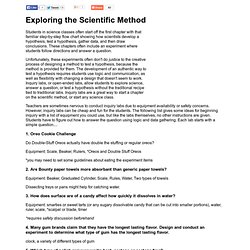
These chapters often include an experiment where students follow directions and answer a question. Unfortunately, these experiments often don't do justice to the creative process of designing a method to test a hypothesis, because the method is provided for them. The development of an authentic way to test a hypothesis requires students use logic and communication, as well as flexibility with changing a design that doesn't seem to work. Inquiry labs, or open-ended labs, allow students to explore science, answer a question, or test a hypothesis without the traditional recipe tied to traditional labs. Inquiry labs are a great way to start a chapter on the scientific method, or start any science class. 1.
Do Double-Stuff Oreos actually have double the stuffing or regular oreos? Demography Study Using Cemetery Data. A cemetery is an excellent place to study human demography.
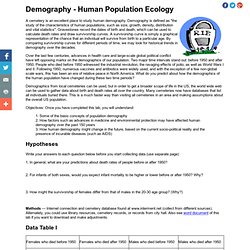
Demography is defined as "the study of the characteristics of human populations, such as size, growth, density, distribution and vital statistics". Gravestones record the dates of birth and death, which can be used to calculate death rates and draw survivorship curves. A survivorship curve is simply a graphical representation of the chance that an individual will survive from birth to a particular age. By comparing survivorship curves for different periods of time, we may look for historical trends in demography over the decades. Over the last few centuries, advances in health care and large-scale global political conflict have left opposing marks on the demographics of our population. Demographics from local cemeteries can be used, but in order to get a broader scope of life in the US, the world wide web can be used to gather data about birth and death rates all over the country. Population Biology. Intrepreting Ecological Data.
Name:______________________________________Date:_______________ Graph 1: Rabbits Over Time a.
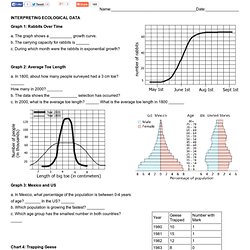
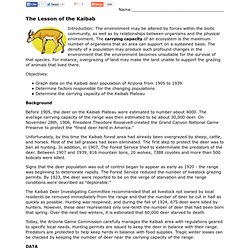
The graph shows a __________ growth curve. b. The carrying capacity for rabbits is ______ c. During which month were the rabbits in exponential growth? Graph 2: Average Toe Length. The Lesson of the Kaibab. Name:_____________________________________
Deer: Predation or Starvation. Name: ___________________________________Date:____________ Introduction: In 1970 the deer population of an island forest reserve about 518 square kilometers in size was about 2000 animals.
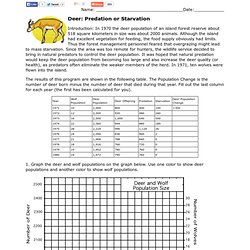
Although the island had excellent vegetation for feeding, the food supply obviously had limits. Thus the forest management personnel feared that overgrazing might lead to mass starvation. Estimating Population Size. Names__________________________________ __________________________________________ Objective: You will be expected to estimate the size of a sample population using the mark-recapture technique.
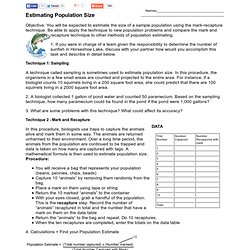
Be able to apply the technique to new population problems and compare the mark and recapture technique to other methods of population estimating. 1. If you were in charge of a team given the responsibility to determine the number of sunfish in Horseshoe Lake, discuss with your partner how would you accomplish this task and describe in detail below. Www-tc.pbs.org/nationalparks/media/pdfs/tnp_lesson_plan_this_is_america.pdf. Www-tc.pbs.org/nationalparks/media/pdfs/tnp_lesson_plan_campfire_conversation.pdf.
Www-tc.pbs.org/nationalparks/media/pdfs/tnp_lesson_plan_tourism_and_preservation.pdf.