
Trabajando con carto.pdf. Trabajando con carto.odt. Wiki Inventor's Fork: FEDERATED WIKIS. Ward Cunningham, the creator of the wiki, is proud of his invention.

“We changed the world together,” he says of those who contributed to his software development site C2, which spawned the online collaboration software that underpins Wikipedia and countless other services across the net. But there is one thing about the wiki that he regrets. “I always felt bad that I owned all those pages,” he says. The central idea of a wiki — whether it’s driving Wikipedia or C2 — is that anyone can add or edit a page, but those pages all live on servers that someone else owns and controls. Cunningham now believes that no one should have that sort of central control, so he has built something called the federated wiki.
This new creation taps into the communal ethos fostered by GitHub, a place where software developers can not only collaborate on software projects but also instantly “fork” these projects, spawning entirely new collaborations. The federated wiki is an attempt to solve these problems.
Gephi-tutorial-quick_start.pdf. Un dispositif pédagogique autour de la datavisualisation pour les lycées de rhône-alpes. – Innovation en éducation – Algorithmic writings. Workshop -Dataviz midi pyrénées. La Région Midi-Pyrénées cherche à montrer son caractère dynamique dans le domaine des nouvelles technologies et de l’innovation.
Un appel est émis par les services de la région proposant plusieurs projets d’analyse ou de valorisation utilisant des données. Atelier_conversion_données. Dataviz - OUTILS. De nombreux outils, pas toujours évident de s’y retrouver Conversion de données Pour plus d’info, voir cette page.
Convertir un PDF en CSV : Tabula (à télécharger) Cartographie TileMill (gratuit, à télécharger) CartoDB (en ligne, payant) Visualization There is a bunch of good tools & softwares out there to create infographics and visualization. Desktop software : Gephi : for network-related visualization. Our Data Literacy Research Findings. In 2015 School of Data started its first research project to understand data literacy efforts around the world.
In the lead up to the publication of the final report, we’re publishing a series of blog posts to share our findings. The goal is to provide them in an accessible format, benefitting both data literacy practitioners and a wider network of peers. Hopefully, this examination of techniques and methodologies currently employed by actors within and outside the network can provide with a pool of knowledge to be used in building and developing data literacy efforts.
We Need Both Networks and Communities. If you want to understand the difference between a network and a community, ask your Facebook friends to help paint your house.

Social media certainly connects us to whoever is on the other end of the line, and so extends our social networks in amazing ways. But this can come at the expense of deeper personal relationships. When it feels like we’re up-to-date on our friends’ lives through Facebook or Instagram, we may become less likely to call them, much less meet up. Networks connect; communities care. Marshall McLuhan wrote famously about the “global village,” created by new information technologies. A century or two ago, the word community “seemed to connote a specific group of people, from a particular patch of earth, who knew and judged and kept an eye on one another, who shared habits and history and memories, and could at times be persuaded to act as a whole on behalf of a part.” El arte funcional - Infografía y visualización de información. INTRO TO INFORMATION DESIGN. Information design is about understanding data.
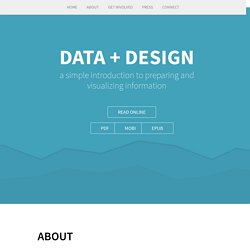
Whether you’re writing an article for your newspaper, showing the results of a campaign, introducing your academic research, illustrating your team's performance metrics, or shedding light on civic issues, you need to know how to present your data so that other people can understand it. Regardless of what tools you use to collect data and build visualizations, as an author you need to make decisions around your subjects and datasets in order to tell a good story.
And for that, you need to understand key topics in collecting, cleaning, and visualizing data. This free, Creative Commons-licensed e-book explains important data concepts in simple language. Think of it as an in-depth data FAQ for graphic designers, content producers, and less-technical folks who want some extra help knowing where to begin, and what to watch out for when visualizing information. Who's behind all of this? Infoactivism: cases by country, issue, tactis, or region. Partage, pratiques non marchandes et humanisme numérique. Voici le texte de mon intervention le 11 février 2015 dans le séminaire L’humain au défi du numérique organisé par Milad Doueihi et Jacques-François Marchandise au Collège des Bernardins.
Bonsoir, merci à Milad Doueihi et Jacques-François Marchandise pour cette invitation à vous présenter quelques idées sur le partage, les biens communs et la façon dont ils restructurent l’espace politique et culturel. Mon intervention est structurée en trois petits temps : le premier se demandera ce que nous partageons dans l’espace numérique, quel statut nous lui donnons et en quoi les formes de partage ainsi rendues possibles sont différentes de celles qui existent dans d’autres domaines. Le second temps défendra que le partage est une activité fondamentalement non marchande, qu’il y a lieu à étudier son interaction avec l’économie marchande, mais que l’expression économie du partage est un oxymore. Communs physiques et communs informationnels. BIF 8: Valdis Krebs - Getting Technology and Sociology to Match. Guerre des récits (ex: Europe VS Grece) F.A.T.