
Keeping an eye on your Web proxy usage with Squid Graph. By Ben Martin on December 05, 2008 (4:00:00 PM) There are many ways to keep an eye on how well a Squid cache is performing, such as setting up Squid to offer Simple Network Management Protocol (SNMP) and using the Multi Router Traffic Grapher (MRTG) or Cacti to monitor Squid through SNMP.
Using Squid Graph as described in this article has the advantage of being quick and easy to set up -- you don't have to know about SNMP or install any other servers. The downside to this is that some of the things you might be interested in investigating will require some command-line interaction instead of using nice Web forms. You'll need Perl and perl-GD installed to use Squid Graph. Installation of Squid Graph is optional; if you like you can copy its directory into /usr/local, or simply invoke it with the command . Squid Graph requires two things to run: the contents of your Squid access.log file and a directory name where you want a Web page detailing graphical information from log to be written. FIXiki WIKIPedia. Eric A. Hall - - Software Projects - - Cacti SuperoDoctor Sensor Readings - November 11, 2010 I try to monitor as many of the motherboard sensors as possible, since they often reveal a variety of hidden problems.
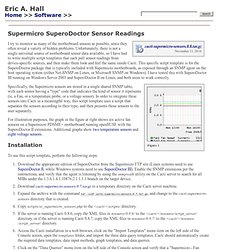
Unfortunately, there is not a single universal source of motherboard sensor data available, so I have had to write multiple script templates that each pull sensor readings from device-specific sources, and then make them look and feel the same inside Cacti. This specific script template is for the SuperoDoctor package that is typically included with Supermicro motherboards, as exposed through an SNMP agent on the host operating system (either Net-SNMP on Linux, or Microsoft SNMP on Windows).
I have tested this with SuperoDoctor III running on Windows Server 2003 and SuperoDoctor II on Linux, and both seem to work correctly. Figure 1 Specifically, the Supermicro sensors are stored in a single shared SNMP table, with each sensor having a "type" code that indicates the kind of sensor it represents (ie, a Fan, or a temperature probe, or a voltage sensor). Templates. In Cacti, a data template provides a skeleton for an actual data source.
If you have many data sources that share most of their characteristics, using a data template would probably make sense. No change of a Data Template is propagated to already existing rrd files. But most of them may be changed by using rrdtool tune from command line. Pay attention to not append new Data Source Items to already existing rrd files. There's no rrdtool command to achieve this! Creating a Data Template To create a new data template, select Data Templates under the Templates heading and click Add. The first thing you must do is give the template a name. Why would I see huge CPU spikes in my monthly r... Sorry for the month long wait haha!
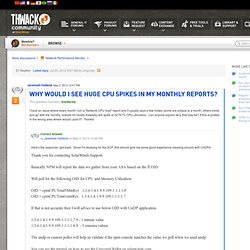
So the engineer suggested I do a MIB walk on this, and found these related MIBs in use CISCO-PROCESS-MIB 1.3.6.1.4.1.9.9.109.1.1.1.1.2.1 cpmCPUTotalPhysicalIndex.1 1. View topic - data template interface bug? View topic - Cisco interface operational status monitor. Построение научных и инженерных графиков с помощью GnuPlot: Часть 1. Введение в GnuPlot. Формат ввода и вывода данных. Введение GnuPlot – это терминальная программа, которая запускается из командной строки (существуют также графические интерфейсы gui).
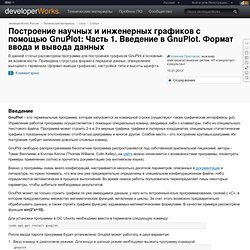
Управление работой программы осуществляется с помощью специальных команд, вводимых либо с клавиатуры, либо из специального текстового файла. Программа может строить 2-х и 3-х мерные графики, графики в полярных координатах, специальные статистические графики с показанным отклонением, столбчатые диаграммы и многое другое. Слабое место – это построение круговых диаграмм.
Их построение требует написания довольно сложных команд. GnuPlot свободно распространяемая бесплатная программа распространяется под собственной оригинальной лицензией, авторы - Томас Виллиямс и Коллин Келли (Thomas Williams, Colin Kelley), на сайте можно ознакомится с возможностями программы, посмотреть примеры применения (сотни) и прочитать документацию (на английском языке). Для установки программы в ОС Ubuntu необходимо ввести в терминале следующую команду: FreeNAC Installation Guide. RRDtool - rrdtune. Rrdtool tune filename [--heartbeat|-h ds-name:heartbeat] [--minimum|-i ds-name:min] [--maximum|-a ds-name:max] [--data-source-type|-d ds-name:DST] [--data-source-rename|-r old-name:new-name] [--deltapos scale-value] [--deltaneg scale-value] [--failure-threshold failure-threshold] [--window-length window-length] [--alpha adaption-parameter] [--beta adaption-parameter] [--gamma adaption-parameter] [--gamma-deviation adaption-parameter] [--smoothing-window fraction-of-season] [--smoothing-window-deviation fraction-of-season] [--aberrant-reset ds-name] The tune option allows you to alter some of the basic configuration values stored in the header area of a Round Robin Database (RRD).
One application of the tune function is to relax the validation rules on an RRD. This allows to fill a new RRD with data available in larger intervals than what you would normally want to permit. Be very careful with tune operations for COMPUTE data sources. Filename The name of the RRD you want to tune. Plugin:aggregate - Cacti Docs. This plugin adds a new dropdown action to Graph Management, called “Create Aggregate Graphs”.
To use it, please filter the graphs you want to aggregate and select all of those you want to be aggregated. The topmost one serves as a “template” for the basic graph properties. If you like to aggregate graphs of different type (e.g. a traffic graph and a graph showing the numbers of logged in users), no one will stop you doing so. But in case you want to interpret the data, this will be left to you. So, better aggregate graphs of same graph template. Be aware: If the basic graphs include e.g. If the basic graph includes “COMMENTS”, you may want to delete some of them as well. Graph templates may omit <HR> line breaks for the last graph item. In general, colors of graph items from different graphs will be equal.
This plugin supports re-colorization by means of “Color Templates”. When aggregating, you will be prompted Title Format: Enter a new title for the Template. Install Cacti on CentOS 6. Faq - Cacti Docs. General This area is for user contributed Frequently Asked Questions.
They will be cleaned up and added to the Official FAQ Status Unknown If the status of your device remains 'Unknown', ensure that you have added graphs to that device. If there are no graphs, Cacti will not poll the device, and the status will remain 'Unknown'. How does the Simple Network Management Protocol (SNMP) work? RRDTool Initial Graph does not appear When viewing in tree mode, the initial graph does not show up. This may be an RRDTool version conflict. . — Linegod 2009/10/01 08:09 Can you graph Data Sources (ds) from different RRDs I know it's kind of a pain to update an RRD to add fields after the fact, so I was also looking at potentially showing data from two different RRDs on a single graph. Yes, search the forums1) for 'aggregate', or use the Aggregate plugin2) External Resources Deprecated Warnings.
Usertemplate:data:windows:speedfan - Cacti Docs. Cacti faq. RRDtool - rrdgraph_rpn. Add, subtract, multiply, divide, modulo NAN-safe addition.
If one parameter is NAN/UNKNOWN it'll be treated as zero. If both parameters are NAN/UNKNOWN, NAN/UNKNOWN will be returned. Sine and cosine (input in radians), log and exp (natural logarithm), square root. Arctangent (output in radians). Arctangent of y,x components (output in radians). Example: CDEF:angle=Y,X,ATAN2,RAD2DEG will convert X,Y components into an angle in degrees. Round down or up to the nearest integer. Convert angle in degrees to radians, or radians to degrees. Take the absolute value. Pop one element from the stack. Example: CDEF:x=v1,v2,v3,v4,v5,v6,6,SORT,POP,5,REV,POP,+,+,+,4,/ will compute the average of the values v1 to v6 after removing the smallest and largest. Pop one element (count) from the stack. Example: CDEF:x=a,b,c,d,4,AVG Create a "sliding window" average of another data series.