
Graphes - énoncé — Python pour un Actuaire 0.3.595. Les coordonnées sur une carte se font avec des coordonnées géographiques : longitude et latitude.
La distance entre deux lieux géographiques se calcule grâce à la distance de Haversine. Python Data Visualization Cookbook. Today, data visualization is a hot topic as a direct result of the vast amount of data created every second.

Transforming that data into information is a complex task for data visualization professionals, who, at the same time, try to understand the data and objectively transfer that understanding to others. This book is a set of practical recipes that strive to help the reader get a firm grasp of the area of data visualization using Python and its popular visualization and data libraries. Python Data Visualization Cookbook will progress the reader from the point of installing and setting up a Python environment for data manipulation and visualization all the way to 3D animations using Python libraries. Readers will benefit from over 60 precise and reproducible recipes that guide the reader towards a better understanding of data concepts and the building blocks for subsequent and sometimes more advanced concepts. The Data Visualisation Catalogue.
Data Analysis in Python with Pandas. Ever wonder how you can best analyze data in python?

Wondering how you can advance your career beyond doing basic analysis in excel? Want to take the skills you already have from the R language and learn how to do the same thing in python and pandas? By taking the course, you will master the fundamental data analysis methods in python and pandas! You’ll also get access to all the code for future reference, new updated videos, and future additions for FREE! You'll Learn the most popular Python Data Analysis Technologies! By the end of this course: - Understand the data analysis ecosystem in Python. - Learn how to use the pandas data analysis library to analyze data sets - Create how to create basic plots of data using MatPlotLib - Analyze real datasets to better understand techniques for data analysis At the end of this course you will have learned a lot of the tips and tricks that cut down my learning curve as a business analyst and as a Master’s Student at UC Berkeley doing data analysis.
Colors Tutorial. Flat UI Colors. Modèles de couleurs. Coolors.co - The super fast color schemes generator. Color Emotion Guide. DELL JPMorgan DIVERSITY Nikon ups IMDB BOL SUBWAY NBC DIVERSITY SUBWAY ebay BEST BUY DHL Hertz amazon Sprint TRUST IKEA PENNZOIL NBC monster - Your calling is calling - Google NATIONAL GEOGRAPHIC CHANNEL CAT Denny's HOOTERS NICKELODEON Fanta Lego Kellogg's Nintendo KMART YouTube ORACLE Coca-Cola Syfy Virgin Lowe's CNN starz Cadbury bp vimeo hp intel NASA flicr LAND ROVER Girl Scouts Big Brothers Big Sisters NETFLIX HARLEY-DAVIDSON MOTOR CYCLES AUSSIE Crush Orange Welch's Ford Wordpress Barbie American Express T-Mobile Animal Planet EXXON Walmart Lays ACE The helpful people FritoLay KFC NABISCO Heinz Gulf IBM pfizer publix HESS Apple Nike Hallmark Mercedes Hertz Yahoo!

Orkut tropicaña Spotlfy LYNX payless facebook Canon Walmart OREO puma WHOLE FOODS SunChips McDonalds GOOD YEAR shutterfIy Blogger boost Ferraro AVIS TACOBELL Oral-B CN Cartoon Network. Common Excel Tasks Demonstrated in Pandas - Practical Business Python. Introduction The purpose of this article is to show some common Excel tasks and how you would execute similar tasks in pandas.
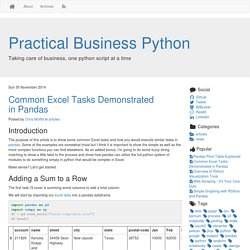
Some of the examples are somewhat trivial but I think it is important to show the simple as well as the more complex functions you can find elsewhere. As an added bonus, I’m going to do some fuzzy string matching to show a little twist to the process and show how pandas can utilize the full python system of modules to do something simply in python that would be complex in Excel. Make sense? Let’s get started. Adding a Sum to a Row The first task I’ll cover is summing some columns to add a total column. We will start by importing our excel data into a pandas dataframe. import pandas as pdimport numpy as npdf = pd.read_excel("excel-comp-data.xlsx")df.head() We want to add a total column to show total sales for Jan, Feb and Mar.
This is straightforward in Excel and in pandas. Next, here is how we do it in pandas: df["total"] = df["Jan"] + df["Feb"] + df["Mar"]df.head()