
K-W-L (Know, Want to Know, Learned) Description K-W-L (Ogle, 1986) is an instructional reading strategy that is used to guide students through a text.

Students begin by brainstorming everything they Know about a topic. This information is recorded in the K column of a K-W-L chart. Students then generate a list of questions about what they Want to Know about the topic. These questions are listed in the W column of the chart. Purpose. 50 recursos y herramientas importantes para bloggers (infografía) Somos muchos los que hemos elegido el formato de blog para poner online nuestro sitio, sus posibilidades de personalización y su adaptabilidad le hacen perfecto para difundir contenidos y artículos en internet.
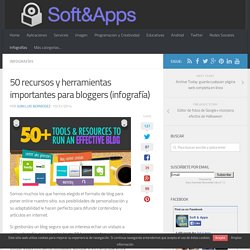
Si gestionáis un blog seguro que os interesa echar un vistazo a esta infografía, nos muestra hasta 50 herramientas y recursos de gran utilidad para los bloggers. No quiere decir que haya que utilizar estas cincuenta utilidades, aunque sí es cierto que entre ellas podemos encontrar a muchas de las que resultan esenciales. Online Photo Sharing, Social Network, Image Hosting, Online Photo Albums.
Education. ThingLink for teachers and schools Create visual experiences for student-centered learning Start now Trusted Partners Sign up now or contact your closest Microsoft or Google for Education reseller.
Award-winning education technology ThingLink is an award-winning education technology platform that makes it easy to augment images, videos, and virtual tours with additional information and links. A solution for classrooms with diverse language backgrounds and reading abilities ThingLink offers an easy way to create audio-visual learning materials that are accessible in an integrated reading tool. Student-centered learning from planning to presentation ThingLink helps students become fluent in using multiple forms of media to express themselves inside and outside the classroom. App Store Google Play Capability and skills development in real-world environments Virtual walk-throughs and tours give students access to real-world environments and situations that would otherwise be out of their reach.
Piktochart Infographics. Herramientas y recursos para el aprendizaje online. 14 Great Tools to Create Engaging Infographics and Images for your Social Media Posts. 3.8K Flares Filament.io 3.8K Flares × It wasn’t long ago that Twitter added inline image previews to its official apps, including the web view.
Now, Twitter is including more image focus in the latest redesign. On the left-hand side of Twitter’s new web view, your profile and header images are now visible. We’ve done tests on our own Twitter account previously that showed images make a huge difference to engagement: Images aren’t just useful for Twitter, either. In particular for looking at Twitter, in a recent research study we conducted, we found that images can increase retweet rate by up to 150%: To make the visual side of your social media strategy a bit easier, here are some tools to help you create awesome pictures. 1.
PicMonkey is a really easy-to-use photo editing tool that runs in your browser. I love how easy-to-use PicMonkey is, and that you can jump in straight away and give it a go without creating an account or even uploading your own photos. 2. Five Good Online Tools for Creating Infographics. In my previous post shared some advice from Randy Krum, author of Cool Infographics, about creating infographics.
In his book Randy devotes a chapter to design tools. Many of the tools used by professional designers cost hundreds or thousands of dollars. But you don't have to spend anything if you want your students to try their hands at creating a data visualization in the form of an infographic. Here are five free tools that your students can use to create infographics. Infogr.am is an online tool for creating interactive charts, graphs, and interactive infographic posters. 10 free tools for creating infographics. Done right, infographics can be a great way to make sense of complex data.
The best infographics transform complex information and data into graphics that are both easy to grasp and visually appealing. The only problem is, infographics that look like they were simple to make are often anything but. Exclusive offer: Save 15% on Adobe Creative Cloud now Here, we've selected our top free tools and apps for making infographics. Some of the options here are even suitable for non-designers, as templates and other features make them easy to use. Give these free tools a try and let us know which ones you get on best with on Facebook or Twitter.
9 Powerful Free Infographic Tools To Create Your Own Infographics - DATA VISUALIZATION. Create Infographics. 20+ Tools to Create Your Own Infographics. A picture is worth a thousand words – based on this, infographics would carry hundreds of thousands of words, yet if you let a reader choose between a full-length 1000-word article and an infographic that needs a few scroll-downs, they’d probably prefer absorbing information straight from the infographic.
What’s not to like? Colored charts and illustrations deliver connections better than tables and figures and as users spend time looking back and forth the full infographic, they stay on the site longer. Plus, readers who like what they see are more likely to share visual guides more than articles. While not everyone can make infographics from scratch, there are tools available on the Web that will help you create your very own infographics. In this article, we’re listing more than 20 such options to help you get your messages across to your readers, visually. Read Also: The Infographic Revolution: Where Do We Go From Here? What About Me? “What About Me?” Vizualize.me Piktochart easel.ly.