
Befolkningspyramid - Matildasdemografi. En befolkningspyramid är en diagramtyp som använd för att åskådliggöra en befolknings ålder- och könssammansättning.
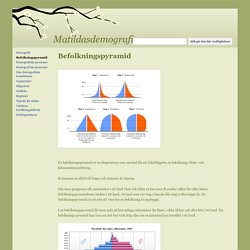
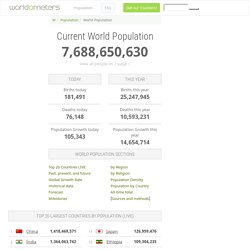
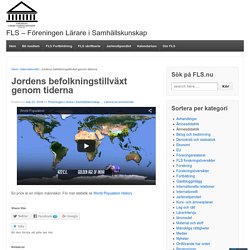
Kvinnorna är alltid till höger och männen åt vänster. Om man grupperar alla människor i ett land i kön och ålder så kan man få exakta siffror för olika behov. Befolkningspyramiderna ändras i ett land, ett land som var steg 1 kanske blir steg 2 efter några år. Human Terrain. Om jordens befolkning var 100 personer. Breathingearth - CO2, birth & death rates by country, simulated real-time. IF 100 PEOPLE LIVED ON EARTH. Population pyramids: Powerful predictors of the future - Kim Preshoff. The European Refugee Crisis and Syria Explained. Push and Pull Factors in Immigration. World Population by the Billion. World Population Clock: 7.6 Billion People. World Population: Past, Present, and Future (move and expand the bar at the bottom of the chart to navigate through time) The chart above illustrates how world population has changed throughout history.
View the full tabulated data. At the dawn of agriculture, about 8000 B.C., the population of the world was approximately 5 million. Jordens befolkningstillväxt genom tiderna. En prick är en miljon människor.
För mer statistik se World Population History Tagged with: befolkning, datavisualisering, jordens befolkning, världen, världsdata, världsstatistik, världsvisualisering Publicerat i Internationellt, läromedel, Material och stoff, Statistik. The #1 reason people die early, in each country. You're probably aware that heart disease and cancer are far and away the leading causes of death in America.
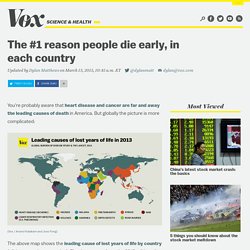
But globally the picture is more complicated: (Vox / Anand Katakam and Joss Fong) It's worth stressing that "cause of lost years of life" and "cause of death" aren't identical. Atlas for a Changing Planet. Understanding natural and human systems is an essential first step toward reducing the severity of climate change and adapting to a warmer future.
Maps and geographic information systems are the primary tools by which scientists, policymakers, planners, and activists visualize and understand our rapidly changing world. Spatial information informs decisions about how to build a better future. Scroll down or click below to explore a sampling of maps from Esri's ArcGIS Online resource on these themes: