
12-clustering. Apache Kylin. Big Data Analytics with R and Hadoop. Cleaning Data with Refine — Data Wrangling Handbook 0.1 documentation. Step 1: Creating a new Project Open Refine (previously Google Refine) is a data cleaning software that uses your web browser as an interface.
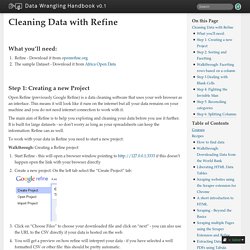
This means it will look like it runs on the internet but all your data remains on your machine and you do not need internet connection to work with it. The main aim of Refine is to help you exploring and cleaning your data before you use it further. It is built for large datasets - so don’t worry as long as your spreadsheets can keep the information: Refine can as well. To work with your data in Refine you need to start a new project: Walkthrough: Creating a Refine project The project will open in the project view, this is the basic interface you are going to work with: by default refine shows only 10 rows of data, you can change this on the bar above the data rows. You now have successfully created your first Refine project.
Step 2: Sorting and Facetting Once we created our project, let’s go and explore the data and the Refine interface a bit. Data integration. Data integration involves combining data residing in different sources and providing users with a unified view of them.[1] This process becomes significant in a variety of situations[2], which include both commercial (such as when two similar companies need to merge their databases) and scientific (combining research results from different bioinformatics repositories, for example) domains.
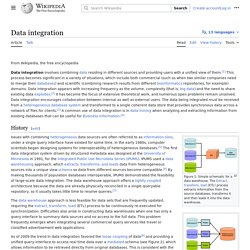
Data integration appears with increasing frequency as the volume (that is, big data[3]) and the need to share existing data explodes.[4] It has become the focus of extensive theoretical work, and numerous open problems remain unsolved. History[edit] Figure 1: Simple schematic for a data warehouse. The Extract, transform, load (ETL) process extracts information from the source databases, transforms it and then loads it into the data warehouse. Pentaho Business Analytics Platform. Data Warehouse ETL Toolkit1. Data Wrangler.
UPDATE: The Stanford/Berkeley Wrangler research project is complete, and the software is no longer actively supported.
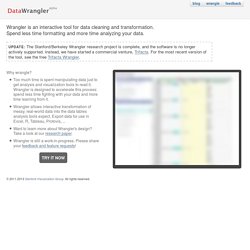
Instead, we have started a commercial venture, Trifacta. For the most recent version of the tool, see the free Trifacta Wrangler. Why wrangle? Data Warehousing and Business Intelligence. DW Books Disappointed with the Google search result of “data warehousing books”, I try to put all data warehousing books that I know into this page.
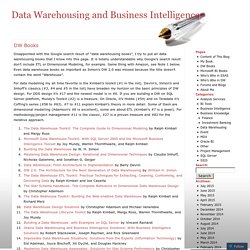
It is totally understandable why Google’s search result don’t include ETL or Dimensional Modeling, for example. Same thing with Amazon, see Note 1 below. Even data warehouse books as important as Inmon’s DW 2.0 was missed because the title doesn’t contain the word “Warehouse”. For data modelling my all time favorite is the Kimball’s toolkit (#1 in the list).
ETL-vs-ELT-White-Paper.pdf. Introducing Morphlines: The Easy Way to Build and Integrate ETL Apps for Hadoop. This post is the first in a series of blog posts about Cloudera Morphlines, a new command-based framework that simplifies data preparation for Apache Hadoop workloads.
To check it out or help contribute, you can find the code here. Cloudera Morphlines is a new open source framework that reduces the time and effort necessary to integrate, build, and change Hadoop processing applications that extract, transform, and load data into Apache Solr, Apache HBase, HDFS, enterprise data warehouses, or analytic online dashboards. If you want to integrate, build, or facilitate transformation pipelines without programming and without substantial MapReduce skills, and get the job done with a minimum amount of fuss and support costs, this post gets you started.
Map_xml_thumb.gif (GIF Image, 600 × 469 pixels) OLTP_sigmod08.pdf. PowerCenter: Enterprise Data Integration Platform. Refine - Google Refine, a power tool for working with messy data (formerly Freebase Gridworks) Sqoop - Stonebraker. Student's t-test. Statistical method The t-test is any statistical hypothesis test in which the test statistic follows a Student's t-distribution under the null hypothesis.
A t-test is most commonly applied when the test statistic would follow a normal distribution if the value of a scaling term in the test statistic were known. When the scaling term is unknown and is replaced by an estimate based on the data, the test statistics (under certain conditions) follow a Student's t distribution. The t-test can be used, for example, to determine if the means of two sets of data are significantly different from each other. History[edit] The term "t-statistic" is abbreviated from "hypothesis test statistic". Gosset had been hired owing to Claude Guinness's policy of recruiting the best graduates from Oxford and Cambridge to apply biochemistry and statistics to Guinness's industrial processes.[13] Gosset devised the t-test as an economical way to monitor the quality of stout. Uses[edit] Assumptions[edit] where Let Then or. Syncsort - Resource Center. Delivering Smarter ETL Through Hadoop Most organizations are using Hadoop to collect, process and distribute data – which is actually ETL (Extract, Transform and Load).
But current ETL tools don’t deliver on Hadoop. People. Transforming. Data. VelociData - Stream Big. Welcome to Apache Flume — Apache Flume.