
9 Data Visualization Tools for Librarians and Educators. Data visualization and infographics tools are a great way to keep students and readers engaged.

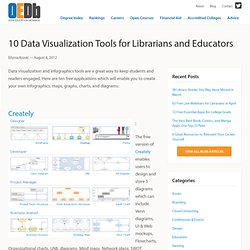
Here are ten free applications which will enable you to create your own infographics, maps, graphs, charts, and diagrams: Creately The free version of Creately enables users to design and store 5 diagrams which can include Venn diagrams, UI & Web mockups, Flowcharts, Organizational charts, UML diagrams, Mind maps, Network plans, SWOT analysis, Value stream maps, TQM diagrams and more. Stat Planet. Blog Archive » Self-grading multiple-choice tests with Google Docs. Speedtest.net - The Global Broadband Speed Test. GELessons.com. A N I M O T O. TagCrowd - make your own tag cloud from any text. Flash Kit, A Flash Developer Resource for Macromedia Flash MX Tutorials SWF FLA images clipart Sounds WAVS Animations Help and Support.
Websites as graphs - an HTML DOM Visualizer Applet.