
World Internet Users Statistics Usage and World Population Stats. GaWC - The World According to GaWC 2012. HESA - Higher Education Statistics Agency - HESA - Higher Education Statistics Agency. Student population The total number of HE enrolments at UK higher education institutions (HEIs) stood at 2,340,275 in 2012/13, a decrease of 6.3% from 2011/12.

This reflects a general decline across the sector in all modes and levels of study which coincides with changes to the tuition fee arrangements. Postgraduate enrolments decreased by 5.6% and undergraduate enrolments decreased by 6.4% between 2011/12 and 2012/13. Full-time enrolments decreased by 2.3% while part-time enrolments showed a sharper decline of 15.1% over the same period. 2.38 million students were studying for a qualification or for credit at 161 HEIs in 2012/13. A small proportion of these students (1.5%) were studying at further education (FE) level1. Table A [xlsx 13 KB] provides the numbers and proportions of HE students studying at each level with comparisons between full-time and part-time.
Chart 1 below illustrates the breakdown of HE students by level and mode of study (sourced from Table A [xlsx 13 KB]). Sex. Trade Statistics - Manual on Statistics of International Trade in Services. Toutes les populations du monde.
Maps. International trade and tariff data. World Trade Organization - Home page. Finding Statistics: U.S. and International. N Finding U.S. and International Statistics Introduction Facts or figures are often used in studies or reports to make a point.

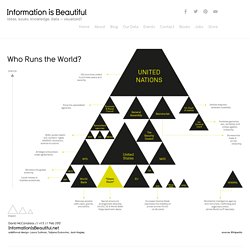
These values, which are often referred to as statistics, tend to be aggregate counts, totals, sums, or averages. In the print world, this type of numerical information is typically found in statistical abstracts, census monographs, and serial publications from Statistics Canada or other government agencies, such as the Bank of Canada. This document deals with the location of statistics (as opposed to raw or primary research data), in computer-readable form, with an emphasis on national statistics. Some resources linked here are restricted access to University of Toronto faculty, students and staff only. International and other statistics Directories of resources CESSDA thematic data Country statistical yearbooks (University of Wisconsin, Madison. General sources. Who Runs The World? » Purchase: Amazon US or Barnes & Noble | UK or Waterstones » Download: Apple iBook | Kindle (UK & US) » See inside.
Institute for Statistics: UNESCO Institute for Statistics. World Statistics, Country Comparisons. The Datahub. The World Bank. Accueil : Observation et statistiques. UNdata.
International Human Development Indicators - UNDP. Home - Indicators Database. OECD Statistics (GDP, unemployment, income, population, labour, education, trade, finance, prices...) USGS Minerals Information: Mineral Commodity Summaries. Published on an annual basis, this report is the earliest Government publication to furnish estimates covering nonfuel mineral industry data.

Data sheets contain information on the domestic industry structure, Government programs, tariffs, and 5-year salient statistics for over 90 individual minerals and materials. Google's Public Data Explorer. Quandl - Find, Use and Share Numerical Data. Statistiques mondiales écologiques. Le Planetoscope permet de mesurer les ordres de grandeurs essentiels du développement durable et de l'écologie, rapportés à la seconde Satistiques mondiales et environnement : les cartes Les statistiques mondiales peuvent être illustrées de manière frappante par la cartographie. Voici quelques exemples de cartes ou de graphiques qui parlent d'elles-mêmes.
Le monde la nuit Cette carte provient de » The Universe: 365 Days » de Robert Nemiroff, livre lui même inspiré du blog de la Nasa « Astronomy Picture Of the Day« . Les océans Océans : Sur la carte des océans ci-dessous, il n'y a quasiment plus de zone bleue, non polluée par l'homme. Le 1er atlas de la pollution mondiale montre une situation catastrophique qui surprend même les experts. Richesse Voici la planète une fois les pays redessinés proportionnellement à la richesse de leurshabitants ! Plus le pays est gros, plus le pouvoir d’achat par habitant est fort.
En savoir plus dans cet Atlas des inégalités. Key data. These UK surveys can be used to produce national estimates.

They can all be used to describe a population at one point of time and most can be used to compare populations at more than one time point. Many are large surveys that are used to inform policy. Discover data from UK surveysDiscover case studies relating to UK surveys The Annual Population Survey (APS) combines data from the Labour Force Survey (LFS) and national boosts. Datasets contain 12 months of data and responses from 155,000 households and 360,000 people. It thus improves intercensal monitoring of key variables for a range of policy purposes. StatsAPEC - Data for the Asia-Pacific region - economic and social statistics & bilateral trade and investment flows.
Consulter les bases de données. Covid-19: Thematic section Housing in Europe – Statistics visualised Have house prices or rents gone up or down in your country in recent years?
What share of the population live in owned or rented homes? Explore the new interactive publication "Housing in Europe – statistics visualised" which shows the latest figures on many different aspects of housing. > more Regions in Europe – Statistics visualised How does your region compare? > more. Portail de la statistique publique.