
The Night Bookmobile. All of our data journalism in one spreadsheet. Data journalism and visualisation from the Guardian Illustration: Lisa Villani for the Guardian Today we have a list of all the data journalism produced here on the Guardian datablog.
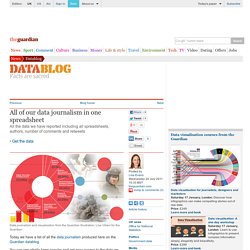
You can see what's been popular and get easy access to the data we have curated as this list shows each datablog post's associated spreadsheets, authors, the number of comments and retweets. By sorting the blog posts by the number of retweets, we can see that Iraq War Logs formed the base of our most retweeted post, followed by a recent post from David McCandless on fish stocks. Sorting by comments shows that the Fukushima nuclear power plant updates were the subject of the greatest discussion, closely followed by Every Doctor Who villain since 1963.
The list shows that in two years we have covered a huge range of data sets. The British government have been publishing more detailed spending data than any of their predecessors, and this has not escaped our attention. Here's all the data. Data summary More data. The 100 essential websites. Andy Warhol talked of a time when everyone would be famous for 15 minutes.
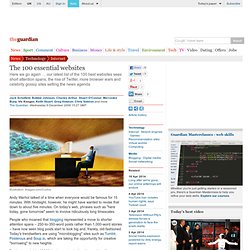
With hindsight, however, he might have wanted to revise that down to about five minutes. On today's web, phrases such as "here today, gone tomorrow" seem to involve ridiculously long timescales. People who moaned that blogging represented a move to shorter attention spans – 250-to-350-word posts rather than 1,000-word stories – have now seen blog posts start to look big and, frankly, old-fashioned. Today's trendsetters are using "microblogging" sites such as Tumblr, Posterous and Soup.io, which are taking the opportunity for creative "borrowing" to new heights. But the smash hit of 2009 has been (apologies: I know this will cause pain) Twitter, where 1,000-word stories are reduced to 140-character tweets. Twitter's rapid growth and open programming interface have given the site a wide impact. Major web players such as Facebook, Google, and Microsoft also got involved. Blogging/microblogging Browsers Cartoons Film Maps.
The internet at sort-of-40. How did we get here? The internet is sort-of-40 this year.

Not in the sense of a Hollywood actor who is in reality much older but prefers to act vague, however. In the sense that if you set the October 1969 networking of US research universities through Arpanet as the start point then it is a significant birthday. To mark this, we want to tell the internet's story. This is not the first time this has been done and will not be the last, but we want to tell the story of the internet using the internet – that is, the people who use it.
Below there is a list of 30 events from the past 40 years – encompassing the technological development of the internet and some of the impact it has had on culture, business, politics and society. But these 30 events are not the only ones that mattered. At the bottom of this page is a form where we would like you to nominate events memorable to you, be they ones we may already know about or something more personal such as the first websites you used or emails you sent.