
Air Quality - GLOBE.gov. CILab: Earth's Atmosphere Layers. Ozone Layer Shielding Our Planet. Greenhouse Gases - Energy Explained, Your Guide To Understanding Energy - Energy Information Administration. Did you know?
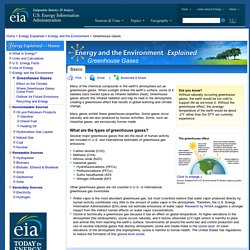
Without naturally occurring greenhouse gases, the earth would be too cold to support life as we know it. Without the greenhouse effect, the average temperature of the earth would be about -2°F rather than the 57°F we currently experience. Many of the chemical compounds in the earth's atmosphere act as greenhouse gases. When sunlight strikes the earth’s surface, some of it radiates back toward space as infrared radiation (heat). Greenhouse gases absorb this infrared radiation and trap its heat in the atmosphere, creating a greenhouse effect that results in global warming and climate change. Many gases exhibit these greenhouse properties. Several major greenhouse gases that are the result of human activity are included in U.S. and international estimates of greenhouse gas emissions: Other greenhouse gases are not counted in U.S. or international greenhouse gas inventories.
Solar paint offers endless energy from water vapor: Compound catalyses splitting of water molecules ScienceDaily. Where Greenhouse Gases Come From Energy Explained, Your Guide To Understanding Energy Energy Information Administration. UCAR Ozone in Our Neighborhood. Activity 2 Teacher Guide: How High Does the Atmosphere Go? Portions of this activity have been modified from "Global Warming and the Greenhouse Effect," Great Explorations in Math and Science (GEMS) series.
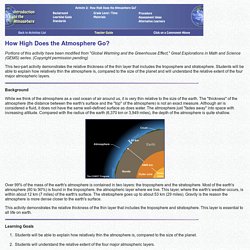
(Copyright permission pending) Layers of the Atmosphere. The envelope of gas surrounding the Earth changes from the ground up.
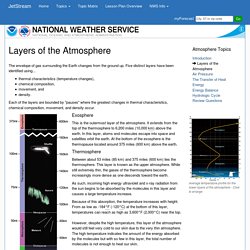
Five distinct layers have been identified using... thermal characteristics (temperature changes),chemical composition,movement, anddensity. Each of the layers are bounded by "pauses" where the greatest changes in thermal characteristics, chemical composition, movement, and density occur. Exosphere. NWS JetStream MAX - The Structure of the Ionosphere. This absorption of radiation is also responsible for the ionosphere.
Located within the thermosphere, the ionosphere is made of electrically charged gas particles (ionized). The ionosphere extends from 37 to 190 miles (60-300 km) above the earth's surface. It is divided into three regions or layers; the F-Region, E-Layer and D-Layer. During the daytime the F-Layer splits into two layers then recombines at night. Good Up High Bad Nearby - What is Ozone? Updated September 2014 View or print brochure in PDF(2003, 2 pp., 1.4MB, about PDF) What is ozone?
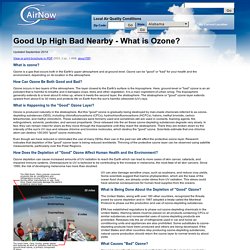
Ozone is a gas that occurs both in the Earth's upper atmosphere and at ground level. Ozone can be "good" or "bad" for your health and the environment, depending on its location in the atmosphere. How Can Ozone Be Both Good and Bad? NWS JetStream Learning Lesson: Water Cycle Paper Craft. Overview Water moves from the ground to the atmosphere and then returns to the ground, however, the actual path water takes in its cycle is more complicated.

There are many stops on water's journey. Students will learn how the water cycle works using 3-D paper craft activity. Procedure. SVS: Chemical Model Animation of O2 being Broken Up and Reforming as O3. SVS: Ozone Layer Shielding Our Planet. Greenhouse_2011. Atmosphere - animated diagram. A Year in the Life of Carbon Dioxide. Launched in 2014, the Orbiting Carbon Observatory-2 (OCO-2) has been collecting NASA’s first detailed, global measurements of carbon dioxide in the atmosphere.
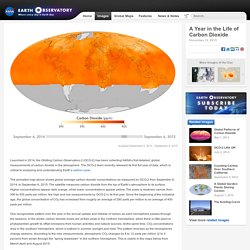
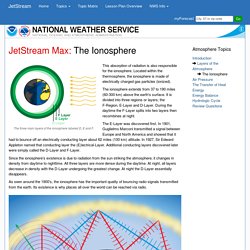
The OCO-2 team recently released its first full year of data, which is critical to analyzing and understanding Earth’s carbon cycle. The animated map above shows global average carbon dioxide concentrations as measured by OCO-2 from September 6, 2014, to September 6, 2015. The satellite measures carbon dioxide from the top of Earth’s atmosphere to its surface. Higher concentrations appear dark orange, while lower concentrations appear yellow.
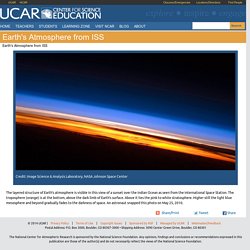
The scale is relatively narrow, from 390 to 405 parts per million, the high and low measurements by OCO-2 in its first year. One recognizable pattern over the year is the annual uptake and release of carbon as each hemisphere passes through the seasons. Carbon naturally cycles through earthly environments. Related ReadingNASA (2015, November 12) A Breathing Planet, Off Balance. UCAR Center for Science Education. UCAR Center for Science Education. UCAR Center for Science Education. Scied ucar edu Troposphere Diagram. UCAR Center for Science Education. Closures/Emergencies Skip to main content Earth's Atmosphere from ISS You are here Home Credit: Image Science & Analysis Laboratory, NASA Johnson Space Center.
Greenhouse Effect Movie - Scott Denning. Closures/Emergencies Skip to main content Greenhouse Effect Movie - Scott Denning You are here Home Download video: Original, MPEG-4, OGG Professor Scott Denning of Colorado State University explains how greenhouse gases in Earth's atmosphere warm our planet.

Credit: Changing Climates project at Colorado State University. In this movie, Professor Scott Denning of the Atmospheric Science Department at Colorado State University explains how greenhouse gases in Earth's atmosphere warm our planet.