
Repeated Measures of ANOVA in R Complete Tutorial » finnstats. Repeated Measures of ANOVA in R, in this tutorial we are going to discuss one-way and two-way repeated measures of ANOVA.

In this case, the same individuals are measured the same outcome variable under different time points or conditions. This test is also known as a within-subjects ANOVA or ANOVA with repeated measures. Data Science Jobs Assumptions 1. To identify the outlier, you can use the box plot method or the three sigma limit method. 2. The outcome of the dependent variable should be normally distributed in each cell of the design. Based on the Shapiro Wilks test can use it for the same. 3. These can be checked based on the anova_test function. Sphericity can be checked using Mauchly’s test of sphericity, which is automatically reported when using the R function anova_test() The above assumptions are not met then you can use an alternative of Repeated Measures ANOVA in the nonparametric method (Friedman Test).
How to do Repeated Measures ANOVAs in R. Compare Tube Types with R – Repeated Measures ANOVA. Background Sometimes we might want to compare three or four tube types for a particular analyte on a group of patients or we might want to see if a particular analyte is stable over time in aliqioted samples.
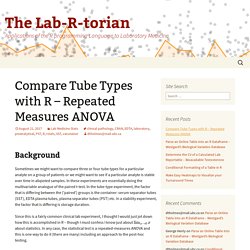
In these experiments are essentially doing the multivariable analogue of the paired t-test. In the tube-type experiment, the factor that is differing between the ('paired') groups is the container: serum separator tubes (SST), EDTA plasma tubes, plasma separator tubes (PST) etc. In a stability experiment, the factor that is differing is storage duration. Since this is a fairly common clinical lab experiment, I thought I would just jot down how this is accomplished in R – though I must confess I know just about \lim_{x\to0}x about statistics.
Some Fake Data to Work With I'm going to make some fake data. Two-Way ANOVA with Repeated Measures. NOTE: This post only contains information on repeated measures ANOVAs, and not how to conduct a comparable analysis using a linear mixed model.

For that, be on the lookout for an upcoming post! When I was studying psychology as an undergraduate, one of my biggest frustrations with R was the lack of quality support for repeated measures ANOVAs.They’re a pretty common thing to run into in much psychological research, and having to wade through incomplete and often contradictory advice for conducting them was (and still is) a pain, to put it mildly. Thankfully, though, they’re not too tricky to set up once you figure out what you’re doing. To get started, let’s construct a phony data set where we’re measuring participant stress on a 100-point scale. Higher numbers mean the participant is more stressed out. First, here’s the code we’ll use to generate our phony data: So we see that we have one row per observation per participant.
Extracting Condition Means Building the ANOVA or image: Influence Analysis for Repeated Measures Data. I am trying exercise 59.8 (page 5057) of the SAS/STAT Users Guide 12.3 in R.

The interesting thing is that influence is investigated on subject level rather than individual level. The diagnostics in nlme does not do leave-subject-out, at least, not that I know of. MCMCglm hardly has any diagnostics. This does not mean no validation is possible, this is R, programming is not optional, but rather expected. Hence with a little bit of work it is possible to estimate PRESS, Cook's D and effects on fixed effects. Data nlme Analysis, standard plot are not too difficult. lSymm <- lme(y ~ Age * Gender, data=rm, random= list(Person =pdSymm(~ fage-1)),method='ML') plot(lSymm, resid(., type = "p") ~ Age | Person) Repeated Measures Analysis with Splus/R. Statistical Computing Seminars Repeated Measures Analysis with R There are a number of situations that can arise when the analysis includes between groups effects as well as within subject effects.
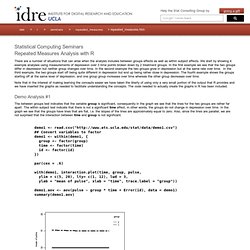
We start by showing 4 example analyses using measurements of depression over 3 time points broken down by 2 treatment groups. In the first example we see that the two groups differ in depression but neither group changes over time. In the second example the two groups grow in depression but at the same rate over time. In the third example, the two groups start off being quite different in depression but end up being rather close in depression. Note that in the interest of making learning the concepts easier we have taken the liberty of using only a very small portion of the output that R provides and we have inserted the graphs as needed to facilitate understanding the concepts.
Demo Analysis #1 Demo Analysis #2 Demo Analysis #3 Demo Analysis #4 Exercise data Further Issues Missing Data Independence. Post hoc test after ANOVA with repeated measures using R.