
MANOVA(Multivariate Analysis of Variance) using R - Statistical Aid. What is MANOVA (Multivariate Analysis of Variance)?

MANOVA is an extension to univariate ANOVA that includes at least two dependent variables to analyze differences between multiple groups in the independent variable.In contrast to ANOVA, where we compare individual group means, MANOVA compares the vectors containing the group mean of each dependent variable.MANOVA uses omnibus Wilk’s Lambda, Pillai’s Trace (most robust to departures from assumptions), Roy’s Largest Root, or Hotelling-Lawley’s test, which are later converted to F statistics for assessing the significance of the group differences. Pillai’s Trace has the highest statistical power.MANOVA maximizes the discrimination in between-groups than within-groups based on best linear combinations of the multiple response variables. Why MANOVA is useful? MANOVA analyzes the differences among groups in an independent variable by considering multiple dependent variables. Analysis of Variance in R: 3 Steps » finnstats. How to perform ANCOVA in R » Quick Guide » finnstats.
ANCOVA in R, Analysis of covariance is used to measure the main effect and interaction effects of categorical variables on a continuous dependent variable while controlling the effects of selected other continuous variables which is co-vary with the dependent.
We can take one of the simple examples to conduct ANCOVA in R. Identify the studying technique has an impact on exam scores by using the following parameters. Everything You Always Wanted to Know About ANOVA* ANOVA vs Multiple Comparisons – Predictive Hacks. When we run an ANOVA, we analyze the differences among group means in a sample.
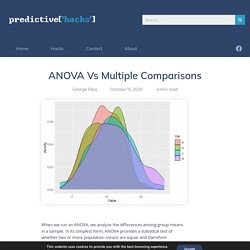
In its simplest form, ANOVA provides a statistical test of whether two or more population means are equal, and therefore generalizes the t-test beyond two means. ANOVA Null and Alternatve Hypothesis The null hypothesis in ANOVA is that there is no difference between means and the alternative is that the means are not all equal. This means that when we are dealing with many groups, we cannot compare them pairwise. We can simply answer if the means between groups can be considered as equal or not. Tukey’s HSD What about if we want to compare all the groups pairwise? ANOVA in R - Stats and R. ANOVA (ANalysis Of VAriance) is a statistical test to determine whether two or more population means are different.
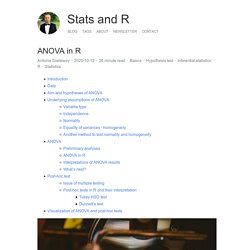
In other words, it is used to compare two or more groups to see if they are significantly different. In practice, however, the: Introduction to ANOVA for Statistics and Data Science. How to do a t-test or ANOVA for many variables at once in R and communicate the results in a better way - Stats and R. T-test Although it was working quite well and applicable to different projects with only minor changes, I was still unsatisfied with another point.
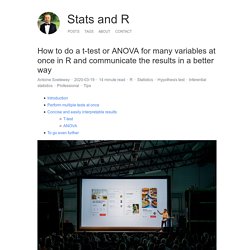
Someone who is proficient in statistics and R can read and interpret the output of a t-test without any difficulty. However, as you may have noticed with your own statistical projects, most people do not know what to look for in the results and are sometimes a bit confused when they see so many graphs, code, output, results and numeric values in a document. They are quite easily overwhelmed by this mass of information. With my old R routine, the time I was saving by automating the process of t-tests and ANOVA was (partially) lost when I had to explain R outputs to my students so that they could interpret the results correctly. Of course, they came to me for statistical advices, so they expected to have these results and I needed to give them answers to their questions and hypotheses. The end of errors in ANOVA reporting. A Simple Introduction to ANOVA (with applications in Excel)
One-way ANOVA in R. Suppose as a business manager you have the responsibility for testing and comparing the lifetimes of four brands (Apollo, Bridgestone, CEAT and Falken) of automobile tyres.

The lifetime of these sample observations are measured in mileage run in ’000 miles. For each brand of automobile tyre, sample of 15 observations have been collected. On the basis of these information, you have to take you decision regarding the four brands of automobile tyre. The data is provided in the csv file format (called, tyre.csv). In order to test and compare the lifetimes of four brands of tyre, you should apply one-way ANOVA method as there is only one factor or criterion (mileage run) to classify the sample observations. Data Import and Outlier Checking Let us first import the data into R and save it as object ‘tyre’. Tyre<- read.csv(file.choose(),header = TRUE, sep = ",") attach(tyre) is.factor(Brands) [1] TRUE As the result is ‘TRUE’, it signifies that the variable ‘Brands’ is a categorical variable. Effect Size Statistics for Anova Tables #rstats – Strenge Jacke! My sjstats-package has been updated on CRAN.
The past updates introduced new functions for various purposes, e.g. predictive accuracy of regression models or improved support for the marvelous glmmTMB-package. The current update, however, added some ANOVA tools to the package. In this post, I want to give a short overview of these new functions, which report different effect size measures. These are useful beyond significance tests (p-values), because they estimate the magnitude of effects, independent from sample size. sjstats provides following functions: eta_sq()omega_sq()cohens_f()anova_stats() First, we need a sample model:
Ch 2.4 - 3-way Anova - Quantide - R training & consulting. Download the 3-way Anova cheat sheet in full resolution: 3-way Anova with R cheat sheet This article is part of Quantide’s web book “Raccoon – Statistical Models with R“.
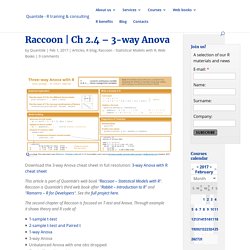
Raccoon is Quantide’s third web book after “Rabbit – Introduction to R” and “Ramarro – R for Developers“. See the full project here. R for Publication by Page Piccinini: Lesson 5 – Analysis of Variance (ANOVA) In today’s lesson we’ll take care of the baseline issue we had in the last lesson when we have a linear model with an interaction.
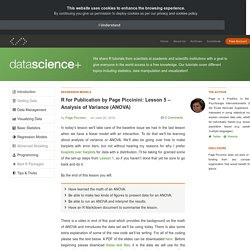
To do that we’ll be learning about analysis of variance or ANOVA. We’ll also be going over how to make barplots with error bars, but not without hearing my reasons for why I prefer boxplots over barplots for data with a distribution. I’ll be taking for granted some of the set-up steps from Lesson 1, so if you haven’t done that yet be sure to go back and do it. By the end of this lesson you will: CRAN - Package granovaGG. This collection of functions in granovaGG provides what we call elemental graphics for display of anova results.
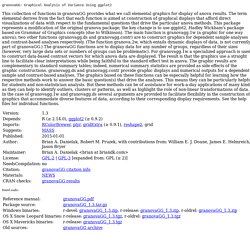
The term elemental derives from the fact that each function is aimed at construction of graphical displays that afford direct visualizations of data with respect to the fundamental questions that drive the particular anova methods. This package represents a modification of the original granova package; the key change is to use ggplot2, Hadley Wickham's package based on Grammar of Graphics concepts (due to Wilkinson). The main function is granovagg.1w (a graphic for one way anova); two other functions (granovagg.ds and granovagg.contr) are to construct graphics for dependent sample analyses and contrast-based analyses respectively. (The function granova.2w, which entails dynamic displays of data, is not currently part of granovaGG.) Downloads: Two-way Analysis of Variance (ANOVA) « Software for Exploratory Data Analysis and Statistical Modelling - Statistical Modelling with R.
The analysis of variance (ANOVA) model can be extended from making a comparison between multiple groups to take into account additional factors in an experiment. The simplest extension is from one-way to two-way ANOVA where a second factor is included in the model as well as a potential interaction between the two factors. As an example consider a company that regularly has to ship parcels between its various (five for this example) sub-offices and has the option of using three competing parcel delivery services, all of which charge roughly similar amounts for each delivery. To determine which service to use, the company decides to run an experiment shipping three packages from its head office to each of the five sub-offices. The delivery time for each package is recorded and the data loaded into R: The data is then displayed using a dot plot for an initial visual investigation of any trends in delivery time between the three services and across the five sub-offices.
Automated determination of distribution groupings - A StackOverflow collaboration. For those of you not familiar with StackOverflow (SO), it's a coder's help forum on the StackExchange website. It's one of the best resources for R-coding tips that I know of, due entirely to the community of users that routinely give expert advise (assuming you show that you have done your homework and provide a clear question and a reproducible example). It's hard to believe that users spend time to offer this help for nothing more than virtual reputation points. I think a lot of coders are probably puzzle fanatics at heart, and enjoy the challenge of a given problem, but I'm nevertheless amazed by the depth of some of the R-related answers. The following is a short example of the value of this community (via SO), which helped me find a solution to a tricky problem.
I have used figures like the one above (left) in my work at various times. In the example above, a Kruskal-Wallis rank sum test is used to test differences across all levels, followed by pairwise Mann-Whitney rank tests.