
Open Data Cities & DataGM. Monday 21 Feb 2011 saw the launch of DataGM, the Greater Manchester Datastore, a partnership between FutureEverything and Trafford Council in Greater Manchester, that developed out of FutureEverything’s Open Data Cities innovation lab.
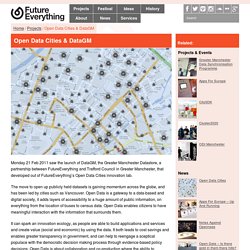
The move to open up publicly held datasets is gaining momentum across the globe, and has been led by cities such as Vancouver. Open Data is a gateway to a data-based and digital society, it adds layers of accessibility to a huge amount of public information, on everything from the location of buses to census data. Open Data enables citizens to have meaningful interaction with the information that surrounds them. It can spark an innovation ecology, as people are able to build applications and services and create value (social and economic) by using the data. The embryonic idea behind Open Data Cities – How would cities evolve if all data was open? Open Data Cities / DataGM was nominated for a Big Chip Award 2011 and a UK Public Sector Digital Awards 2011.
How Much Data is Created Every Minute? The Internet has become a place where massive amounts of information and data are being generated every day.
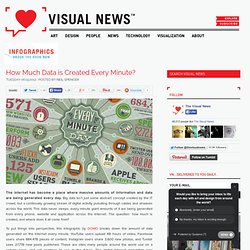
Big data isn’t just some abstract concept created by the IT crowd, but a continually growing stream of digital activity pulsating through cables and airwaves across the world. This data never sleeps: every minute giant amounts of it are being generated from every phone, website and application across the Internet. The question: how much is created, and where does it all come from? To put things into perspective, this infographic by DOMO breaks down the amount of data generated on the Internet every minute.
YouTube users upload 48 hours of video, Facebook users share 684,478 pieces of content, Instagram users share 3,600 new photos, and Tumblr sees 27,778 new posts published. Click here, or the image below for a full-sized version of the graphic. To understand is to perceive patterns. Business analytics and business intelligence leaders - Pentaho.
The dark side of data. Big data. Disinformation Visualization: How to lie with datavis. By Mushon Zer-Aviv, January 31, 2014 Seeing is believing.
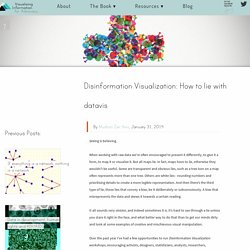
When working with raw data we’re often encouraged to present it differently, to give it a form, to map it or visualize it. But all maps lie. In fact, maps have to lie, otherwise they wouldn't be useful. Some are transparent and obvious lies, such as a tree icon on a map often represents more than one tree. It all sounds very sinister, and indeed sometimes it is. Over the past year I’ve had a few opportunities to run Disinformation Visualization workshops, encouraging activists, designers, statisticians, analysts, researchers, technologists and artists to visualize lies. Centuries before big data, computer graphics and social media collided and gave us the datavis explosion, visualization was mostly a scientific tool for inquiry and documentation. Reproducing Lies Let’s set up some rules. We don’t spread visual lies by presenting false data.
Should we legalize the killing of babies? I would hope most of you would say: No. Data Discrimination Means the Poor May Experience a Different Internet. Data analytics are being used to implement a subtle form of discrimination, while anonymous data sets can be mined to reveal health data and other private information, a Microsoft researcher warned this morning at MIT Technology Review’s EmTech conference.
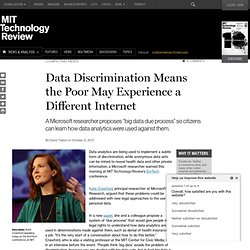
Kate Crawford, principal researcher at Microsoft Research, argued that these problems could be addressed with new legal approaches to the use of personal data. In a new paper, she and a colleague propose a system of “due process” that would give people more legal rights to understand how data analytics are used in determinations made against them, such as denial of health insurance or a job. “It’s the very start of a conversation about how to do this better,” Crawford, who is also a visiting professor at the MIT Center for Civic Media, said in an interview before the event.
During her talk this morning, Crawford added that with big data, “you will never know what those discriminations are, and I think that’s where the concern begins.”