[GRAPHIC DESIGN]
<
floor
Nike Better World
Fey Ilyas' Photostream
Timeline
GE Data Visualization
In the United States, over 20% of our total energy consumption is residential. 
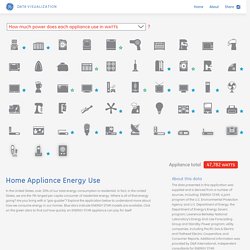
In fact, in the United States, we are the 7th largest per capita consumer of residential energy. Where is all of that energy going?
Home Appliance Energy Use
1 page designs
DOMOTIQUE
usability
Energy Track
Digital
[+]
Webdesign wordpress scheme
Data Visualization changes releases
test everyone
Presentation tools facilement powerpoint
Outils Journalisme Web crafted
Timelines jquery tutorial
Fede webdesigns physical playground
naviguation modni
useful js madrobby
Free Tools timeline contently mockup
Tools google
MODE saint
jQuery jzoopraxiscope plugins javascript
Visualisation de données traine evolution
Javascript jquery images
Homeschool organisation patterns
Marketing sportif rugby
interesting sites portfolio better
jQuery / js video responsive
Outils communes
Effet Parallax parallaxe
visual inspiration visualization piktochart
paralax about empower realizzazione
Timelines facebook hours photo
hybridations LSD/ITYPA/??? création
eco-design project magazine
design helvetica better great
Lignes du temps (frises) creation
Time lines tools create interactive
beaux sites propaganda3 better
Parallax Scrolling blowing ploch company
12/6/28 - 12/7/2 intriguing against human
graph peinture version skeuomorphisme
Web Developer online communications
WEB share design
html5-forms music
Parallaxe campaign
html5 better
Parallax design creative better
My favorite Ads apple durex steve
Parallaxe hands
Navigation crush experience arthur
2012 difunde lumia
sutainability music