
Statistics. Department of Statistics - Texas A&M University. Mathematica Solution for Statistics. Chaîne de khanacademy. Cross Validation. Next: Blackbox Model SelectionUp: Autonomous Modeling Previous: Judging Model Quality by Cross validation is a model evaluation method that is better than residuals.
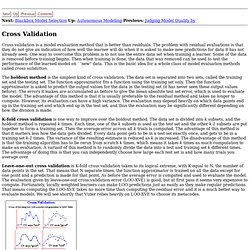
The problem with residual evaluations is that they do not give an indication of how well the learner will do when it is asked to make new predictions for data it has not already seen. One way to overcome this problem is to not use the entire data set when training a learner. Www-stat.stanford.edu/~susan/courses/s200/lectures/lect11.pdf. Maximum likelihood. In statistics, maximum-likelihood estimation (MLE) is a method of estimating the parameters of a statistical model.

When applied to a data set and given a statistical model, maximum-likelihood estimation provides estimates for the model's parameters. The method of maximum likelihood corresponds to many well-known estimation methods in statistics. For example, one may be interested in the heights of adult female penguins, but be unable to measure the height of every single penguin in a population due to cost or time constraints. Assuming that the heights are normally (Gaussian) distributed with some unknown mean and variance, the mean and variance can be estimated with MLE while only knowing the heights of some sample of the overall population. MLE would accomplish this by taking the mean and variance as parameters and finding particular parametric values that make the observed results the most probable (given the model).
Principles[edit] Poisson distribution. In probability theory and statistics, the Poisson distribution (French pronunciation: [pwasɔ̃]; in English often rendered ), named after French mathematician Siméon Denis Poisson, is a discrete probability distribution that expresses the probability of a given number of events occurring in a fixed interval of time or space if these events occur with a known constant mean rate and independently of the time since the last event.[1] The Poisson distribution can also be used for the number of events in other specified intervals such as distance, area or volume.
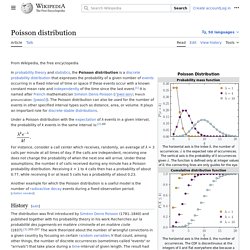
For instance, an individual keeping track of the amount of mail they receive each day may notice that they receive an average number of 4 letters per day. Definitions[edit] Probability mass function[edit] Mercury.bio.uaf.edu/courses/wlf625/readings/MLEstimation.PDF. People.physics.anu.edu.au/~tas110/Teaching/Lectures/L3/Material/Myung03.pdf. IBM SPSS Statistics 19. Type: Applications > Windows Files: Size: 475.98 MiB (499099798 Bytes) Tag(s): SPSS Statistics Uploaded: By: pmp_2010 Seeders: Leechers: Comments Info Hash: (Problems with magnets links are fixed by upgrading your torrent client!)
IBM SPSS Statistics, (formerly PASW Statistics 18) is a comprehensive, easy-to-use set of predictive analytic tools for business users, analysts and statistical programmers. Random assignment. Random assignment or random placement is an experimental technique for assigning subjects to different treatments (or no treatment).
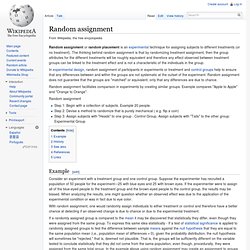
The thinking behind random assignment is that by randomizing treatment assignment, then the group attributes for the different treatments will be roughly equivalent and therefore any effect observed between treatment groups can be linked to the treatment effect and is not a characteristic of the individuals in the group. In experimental design, random assignment of participants in experiments or treatment and control groups help to ensure that any differences between and within the groups are not systematic at the outset of the experiment. Random assignment does not guarantee that the groups are "matched" or equivalent, only that any differences are due to chance. Random assignment facilitates comparison in experiments by creating similar groups. Example compares "Apple to Apple" and "Orange to Orange".
Random assignment Example[edit] History[edit] Prediction interval. In statistical inference, specifically predictive inference, a prediction interval is an estimate of an interval in which future observations will fall, with a certain probability, given what has already been observed.
The distinction between confidence intervals, prediction intervals and tolerance intervals. When you fit a parameter to a model, the accuracy or precision can be expressed as a confidence interval, a prediction interval or a tolerance interval.
The three are quite distinct. The discussion below explains the three different intervals for the simple case of fitting a mean to a sample of data (assuming sampling from a Gaussian distribution). The same ideas can be applied to intervals for any best-fit parameter determined by regression. Confidence intervals tell you about how well you have determined the mean. Assume that the data really are randomly sampled from a Gaussian distribution. Prediction intervals tell you where you can expect to see the next data point sampled. Prediction intervals must account for both the uncertainty in knowing the value of the population mean, plus data scatter. Before moving on to tolerance intervals, let's define that word 'expect' used in defining a prediction interval.
EXCEL 2007: Two-Variable Regression Using Data Analysis Add-in. EXCEL 2007: Two-Variable Regression Using Data Analysis Add-in A.
Colin Cameron, Dept. of Economics, Univ. of Calif. - Davis This January 2009 help sheet gives information on Two-variable linear regression. EXCEL 2007 Basics: Access and Activating Data Analysis Add-in.