
Visualizing online social networks. Data Visualization, Infographics, and Statistics. Colorful, bite-sized graphical representations of the best discoveries we unearth from our data. P2PBusinessVisualization1.jpg (Image JPEG, 2448x1584 pixels) - Redimensionnée (50%) Graphs, maps, trees: abstract models for a literary history - Franco Moretti. Visual Thinking Archive. Visualizations & InfoGraphics.
Visualisation. Hunch. Gapminder For a fact based world view. Ideas, issues, knowledge, data - visualized! Powerful Facts About Visual Communication. Did you know that visuals are processed 60,000 times faster than text?

Or how about the fact that they are processed simultaneously? I wanted to share some interesting facts about visuals with you today from an article by Mike Parkinson of billiondollargraphics.com. Ever wonder why you can process visuals so much faster than text? This is because visuals are processed simultaneously whereas words are processed sequentially. Did you know that visual imagery is more powerful than words alone when used to communicate a message to an audience. A study commissioned by 3M Corporation, suggests that you can be 43% more effective when using visual aids as a presenter. The Stanford Persuasive Technology Lab asked 2,440 participants how they evaluated the credibility of a web site they were shown. Why is this the case? Data Visuals. You may not think you've got much in common with an investigative journalist or an academic medical researcher.

But if you're trying to extract useful information from an ever-increasing inflow of data, you'll likely find visualization useful -- whether it's to show patterns or trends with graphics instead of mountains of numbers, or to try to explain complex issues to a nontechnical audience. There are many tools around to help turn data into graphics, but they can carry hefty price tags. The cost can make sense for professionals whose primary job is to find meaning in mountains of information, but you might not be able to justify such an expense if you or your users only need a graphics application from time to time, or if your budget for new tools is somewhat limited. Visuwords™ online graphical dictionary and thesaurus. Dataviz. Visual Understanding Environment. Visual bookmark. La evolución de la Web. Work » Google » Evolution of the Web 2.0. Jun 28, 2012 | Data Viz , Web The web today is a growing universe of interlinked web pages and web apps, teeming with videos, photos, and interactive content.
What the average user doesn't see is the interplay of web technologies and browsers that makes all this possible. Over time web technologies have evolved to give web developers the ability to create new generations of useful and immersive web experiences. Today's web is a result of the ongoing efforts of an open web community that helps define these web technologies, like HTML5, CSS3 and WebGL and ensure that they're supported in all web browsers. The color bands in this visualization represent the interaction between web technologies and browsers, which power the web apps that we use daily. Hyperakt's role in the project included research and design of the visualization, in collaboration with members of the Google Chrome team.
Services Provided. Envisioning life. DESERTEC Knowledge Platform. The Best Tools for Visualization. Visualization is a technique to graphically represent sets of data.
When data is large or abstract, visualization can help make the data easier to read or understand. There are visualization tools for search, music, networks, online communities, and almost anything else you can think of. Whether you want a desktop application or a web-based tool, there are many specific tools are available on the web that let you visualize all kinds of data.
Here are some of the best: Visualize Social Networks. A visual exploration on mapping complex networks. Visual Dictionary Online. Data Visualization Network of Resources. Visual Thinking Strategies. Design and the Elastic Mind. Outils de visualisation. Jean-louis zimmermann / Stock Photos Nos stratégies d'apprentissage s'élaborent en interaction permanente avec notre environnement.
Et celui-ci, surtout si l'on considère sa composante numérique, est actuellement saturé d'images. Images que l'on regarde, image que l'on fabrique, avec des outils de plus en plus variés et performants. Using Drawing and Visual Thinking to create Rich Pictures. The Leaders of Visual Planning, Team Performance, and Graphic Facilitation for over 30 Years.
Inspiration 8.0 : un logiciel global pour la pensée visuelle. Roberta Faulhaber, facilitation graphique. I've been meaning to share some of the content of EuViz 2014 via my sketchnotes and a brief article for those who were unable to attend or who would like to compare notes.
EuViz was held in Berlin this summer, organized by Guido Neuland of Neuland Gmbh, makers of all those wonderful markers we love and use, and Kommunikationslotsen, a process facilitation consultancy that is deeply involvedin visual facilitation as well. The conference was co-sponsored by the International Forum of Visual Practitioners community, otherwise known as the IFVP.
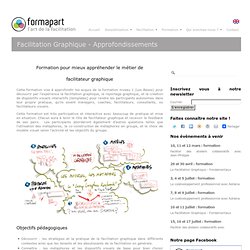
A total of 240 people gathered for a visual/process fest that included 7 of us from France and people from all over the world. The conference was brilliantly organized in tracks and also included participative formats such as a world café, an open forum, and circle dynamics. It was an incredibly enriching experience, taking us all to the next level... Formation : La Facilitation Graphique - Fondamentaux. Formation pour apprendre le langage visuel et l'intégrer dans son activité professionnelle Cette formation vise à faire découvrir par une formation facilitante et active les bases de la facilitation graphique et le reportage graphique pour rendre les participants suffisamment autonomes dans leur propre pratique.
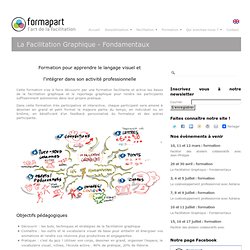
Dans cette formation très participative et interactive, chaque participant sera amené à dessiner en grand et petit format la majeure partie du temps, en individuel ou en binôme, en bénéficiant d’un feedback personnalisé du formateur et des autres participants. Objectifs pédagogiques Découvrir : les buts, techniques et stratégies de la facilitation graphiqueConnaître : les outils et le vocabulaire visuel de base pour embellir et énergiser vos animations et rendre vos réunions plus productives et engageantes.Pratiquer : c’est du jazz ! Facilitation Graphique - Approfondissements. Formation pour mieux appréhender le métier de.
All you need to know about Visual Thinking. Graphic Facilitators. As part of her wider research into the tools and methodologies used by the next generation of global leaders, Heidi Forbes Oste has started down the path of researching the value of “visual practice” (visual facilitation, graphic recording, mindmapping, sketch-noting, etc.)

As a piece of her dissertation, Heidi’s research on the visual practice, although still in the early stages, focuses on how it supports leadership and global teams using social technologies. In this one-hour webinar with Alphachimp's Peter Durand, Heidi answered questions and gave insight into the broader trends at the intersection of social systems, collaborative technology, visual learning, innovation and global leadership. Video & Digital Sketchnotes at. Graphic Facilitation, Visual Recording. Visual Thinking. Facilitation visuelle - home. Graphics plus Fractals and Animations. Visulizations. Hans Rosling. Driven by data. Yau, Nathan: FlowingData. Diagramas & Brainstorming. Thinkmap Visual Thesaurus - An online thesaurus and dictionary o. Tools & Software for DataVis. Interaktywne i filmy. Visualizing Data: Die Bürgschaft. Diagrammr. VisualizeTraffic.com - Visualize How Big A Website Really Is!
Data Visualization for Human Perception. Visualize This. Hans Rosling shows the best stats you've ever seen. The Actual Size of Stuff. WWW Visualization & Infographics. Inografiki i wizualizacje. DataViz. Visual programming. Visualization Tool. Vizualize.me. Visualizing Economics. Visualization. Data and visualization blogs worth following. Data visualization. Visual Thinking. Chart Porn. Data visualization. Gallery: 10 Stunning Science Visualizations.
Browsing visualizations. Data as Art: 10 Striking Science Maps. The computer age triggered a seemingly endless stream of scientific data, but such incoming mountains of information come at a cost.

The more data you amass, the tougher it is to comprehend what you're dealing with.In a push for better perspective, a group of information scientists in 2005 created a decade-long competitive art exhibit called Places & Spaces: Mapping Science. From artistic pop-culture plots to illustrations of the state of scientific collaboration (above), the founders hope winning entries inspire researchers to present their troves of data in clever and digestible ways. "Good science maps give you a holistic understanding of how the data is structured," said information scientist Katy Börner of Indiana University, a founder and curator of the exhibit.
If Twitter Consisted of 100 People [Gorgeous Graphics] A Periodic Table of Visualization Methods. Dipity - Find, Create, and Embed Interactive Timelines. Visualisation. The Art of Complex Problem Solving. Gallery of Computation. LIVING WORKS binary.ring bit.10001 bone.piles box.fitting box.fitting.img new bubble.chamber buddhabrot city.traveler cubic.attractor deep.lorenz guts new happy.place new henon.phase henon.phase.deep new inter.aggregate new inter.momentary new invader.fractal limb.sand.stroke limb.strat limb.stroke mcp moonlight.soyuz nine.block node.garden new offspring orbitals new paths.i peter.de.jong sand.dollar sand.stroke sand.traveler new self-dividing.line stitches substrate new tree.garden.ii trema.disk trema.spike INFORMATION about the programmer about the medium ORDERING works available production qualities ordering policies. A Periodic Table of Visualization Methods. Visual Thinking. Visual Thinking.