
Infographics & Data Visualization. You Suck at Infographics. An infographic, or information graphic, is designed to convey a huge set of data in a fraction of the time that it takes to wade through a dense, numbers-heavy paragraph.
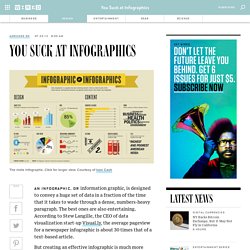
The best ones are also entertaining. According to Stew Langille, the CEO of data visualization start-up Visual.ly, the average pageview for a newspaper infographic is about 30 times that of a text-based article. But creating an effective infographic is much more difficult than just arranging a few charts around a cartoon character. Illustrator Brushes. Featured Certificate border An ornate certificate border.

Change the color of the stroke of your box to change the border's color. The corners don't line up perfectly, but it's pretty darn close. Infographics & Data Visualization. Encartes Pop. NAS CAPAS. Indice de temas Tipografia: origens, formas e uso das letras. Um guia para tipografia histórica e contemporânea, de Paulo Heitlinger. 50 great examples of infographics.