
Eric_Forgues
Minorités linguistiques, gouvernance, développement communautaire, démocratie, environnement, justice sociale.
A fascinating map of the world’s most and least racially tolerant countries. Click to enlarge.
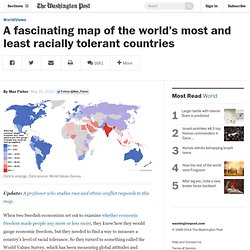
Data source: World Values Survey Update: A professor who studies race and ethnic conflict responds to this map. When two Swedish economists set out to examine whether economic freedom made people any more or less racist, they knew how they would gauge economic freedom, but they needed to find a way to measure a country's level of racial tolerance. So they turned to something called the World Values Survey, which has been measuring global attitudes and opinions for decades. Among the dozens of questions that World Values asks, the Swedish economists found one that, they believe, could be a pretty good indicator of tolerance for other races. Unfortunately, the Swedish economists did not include all of the World Values Survey data in their final research paper. Compare the results to this map of the world's most and least diverse countries. Before we dive into the data, a couple of caveats.
Here's what the data show: • Anglo and Latin countries most tolerant. A revealing map of the world’s most and least ethnically diverse countries. Click to enlarge.
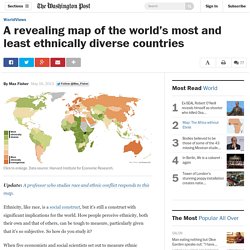
Data source: Harvard Institute for Economic Research. Update: A professor who studies race and ethnic conflict responds to this map. Ethnicity, like race, is a social construct, but it's still a construct with significant implications for the world. How people perceive ethnicity, both their own and that of others, can be tough to measure, particularly given that it's so subjective. So how do you study it? When five economists and social scientists set out to measure ethnic diversity for a landmark 2002 paper for the Harvard Institute of Economic Research, they started by comparing data from an array of different sources: national censuses, Encyclopedia Brittanica, the CIA, Minority Rights Group International and a 1998 study called "Ethnic Groups Worldwide.
" One thing the Harvard Institute authors did with all that data was measure it for what they call ethnic fractionalization. I've mapped out the results above. Now for the data itself. . • Diversity and conflict. 5 insights on the racial tolerance and ethnicity maps, from an ethnic conflict professor. Click to enlarge. Data source: World Values Survey This week, we’ve examined global comparative data on ethnic diversity ( here’s our map of the most and least diverse countries ) and, more controversially, on racial tolerance (here’s our map of countries where people show the highest and lowest levels of racial tolerance) .
I say “controversially” because of the subject’s sensitivity and because reducing such a complicated, subjective phenomenon to a single metric – the frequency with which people in a certain country said they would not want neighbors of a different race – is going to produce some highly disputable results. Steve Saideman, a professor at Carleton University who studies ethnic conflict, responded to the maps on his blog, expanding on some of my points, pushing back on others and offering different takes. You can read his thoughts in full here and here. . (1) It’s tough to gauge racial intolerance through just one metric. . (5) Getting Somalia right.
Données. Données Contactez-nous Accueil.
Données. Langues officielles. LO - santé. Recensement. Europe. Gouvernance. Recherche contexte francophone. Actualité articles. Vidéos Pearltrees. Astuces Pearltrees.