
Behind The Scenes of the Web Design Process [INFOGRAPHIC] (click image to enlarge) Share the INFOGRAPHIC On Your Site, Copy The Code Below: <a href=' target='_blank'><img src=' alt='Periodic Table of Web Design Process' width='540px' border='0' /><br /><strong>Periodic Table of Web Design Process – created by <a href=' target='_blank'>New Design Group</a></strong></a> Looking for a PDF version?
![Behind The Scenes of the Web Design Process [INFOGRAPHIC]](http://cdn.pearltrees.com/s/pic/th/behind-process-infographic-92093980)
Million Lines of Code. MLB Team Valuations. In calculating Major League Baseball team values, Bloomberg News examines revenue from tickets sales, concessions, sponsorships and broadcast rights, as well as interests in TV channels, radio stations and real estate.
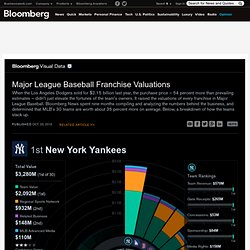
Data for franchise valuations is provided by sports bankers, media consultants, municipalities, financial statements and people familiar with team operations. Calculations for the 2012 season are made available to each team and MLB for review and comment. Four teams didn’t return calls or e-mails. Original. Heatmapbirthdays1.jpg (JPEG Image, 610 × 885 pixels) - Scaled (74%) The infographics of xkcd. Html5-why-developers-need-it.jpg (JPEG Image, 1000 × 4942 pixels) - Scaled (14%) Is Barack Obama the President? Www.mprove.de/script/00/upa/_media/upaposter_85x11.pdf. Life. Web-design-client.jpg (JPEG Image, 1000 × 5733 pixels) 0 (JPEG Image, 257 × 373 pixels) Over 100 Incredible Infographic Tools and Resources (Categorized) This post is #6 in DailyTekk’s famous Top 100 series which explores the best startups, gadgets, apps, websites and services in a given category.

Total items listed: 112. Time to compile: 8+ hours. Follow @DailyTekk on Twitter to make sure you don’t miss a week! Over 100 Incredible Infographic Tools and Resources (Categorized) What Are The Odds? Lemelson Anthropological Scholars Program. The Lemelson Anthropological Fellows/Scholars Program at UCLA was created through the generous vision and support of Professor Robert B.

Lemelson, a psychological anthropologist, documentary filmmaker and distinguished educator. Professor Lemelson has been widely recognized for his progressive philanthropic leadership — much of it at UCLA — most notably through his (FPR), a non-profit foundation supporting research and training bridging the neurosciences and social sciences. The Fellows/Scholars Program grew from Professor Lemelson’s belief that close mentoring relationships and creative, problem-oriented field research skills are of crucial importance in training active and engaged anthropologists.
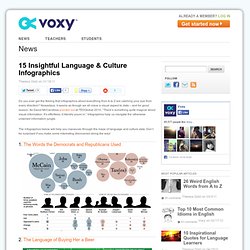
Best Schools In America: Website Rankings. The evolution of the web. 15 Useful Infographics For Designers And Developers. Writen by Bogdan / Comments Off on 15 Useful Infographics For Designers And Developers Information graphics or infographics are graphic visual representations of information, data or knowledge.
These graphics present complex information quickly and clearly,[1] such as in signs, maps, journalism, technical writing, and education. With an information graphic, computer scientists, mathematicians, and statisticians develop and communicate concepts using a single symbol to process information. In this article you will find 15 useful infographics for designers and developers. The evolution of web design Server Headers Infographic Why Websites Speed Really Matters Photoshop Etiquette Manifesto Cloud Computing Landscape Understanding Google PageRank. An HTML5 Interactive Infographic featuring Dribbble. Web Designers vs. Web Developers (Infographic) Qr-codes. The Least And Most Stressful Jobs On The Planet. Original.png (PNG Image, 1036x2075 pixels) - Scaled (31%) Infographic: How to Use Colors in Graphic and Web Designing.
Twitter-users-profile1.jpg (JPEG Image, 1200x900 pixels) - Scaled (71. What the Tweet? 1bntweets3. Occupy Wall Street & Distribution of Wealth. Occupy Wall Street protests have been going strong in New York City for more than a month, with the "Occupy" movement going global, stretching from U.S. cities like Boston and Chicago to Auckland, New Zealand, Rome, Italy and Tokyo.

What's their message? According to the movement's website, "Occupy Wall Street is leaderless resistance movement with people of many colors, genders and political persuasions. Social Media Prisma - ethority weblog. Facebook vs Twitter Infographic - DigitalSurgeons.com. Social Media Demographics: Who?s Using Which Sites? This post was written by Jenny Urbano, our Social Media Manager.

Here at Demandforce, we love seeing and celebrating your ideas! And more than that, we love to hear from YOU. We want to bridge the gap between us and you, so that’s why we’re offering a once in a lifetime opportunity to win a trip to San Francisco, sightsee in this amazing city, visit Demandforce headquarters and share your ideas with us! 6 winners, and a guest of their choice will be flown out to San Francisco, California on March 12-14th, 2014, where they will stay in Union Square, spend a day at Demandforce, have dinner with the team, and explore the lovely City by the Bay!
This is the web right now. 15 Insightful Language & Culture Infographics. Do you ever get the feeling that infographics about everything from A to Z are catching your eye from every direction?
Nowadays, it seems as though we all crave a visual aspect to data – and for good reason. As David McCandless pointed out at TEDGlobal 2010, “There’s something quite magical about visual information. It’s effortless; it literally pours in.” Infographics help us navigate the otherwise untamed information jungle. The infographics below will help you maneuver through the maze of language and culture data. 1. 2. 3.The Language of The Beatles’ Abbey Road 4. 5. 6. 7. 8. 9. 10 Words You Need To Stop Misspelling 10. 11. 12. 13. 14. What is your Date really thinking? The Greatest Recession - Visualizing Unemployment.
The anatomy of a WordPress theme. Index.php – home The index file controls what the homepage of your WordPress theme looks like. By default it is a loop that queries and then displays the most recent blog posts, with a link in the bottom to view previous posts. Alternately, you can specify in wp-admin -> settings -> reading to have the home page be a page you created yourself in WordPress. In that case, you specify a different page/URL for the regular blog posts to appear on, and that page is generated by index.php. single.php – individual posts The display of individual posts in your WordPress theme is controlled by a little file called single.php. How To Create Your Own Wordpress Theme - Jonathan Wold. WordPress Consulting: Looking for professional help with your WordPress project?

For small to medium sized projects, check out my freelance page For large projects, contact me through Sabramedia. New Book from Packt Publishers: WordPress Theme Design - Note: Packt has put together some excellent titles in the paste and I've been given the privilege of reviewing them in the past. They've published a new book on WordPress Theme Design and I highly recommend you give it a look. Iamgreen:The Environmental Impact Of CellPhones.