
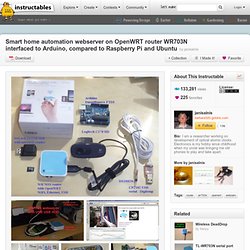
Internet Graphical Interface for Arduino. Smart home automation webserver on OpenWRT router WR703N interfaced to Arduino, compared to Raspberry Pi and Ubuntu. Download the WR703N Digest (340MB zip file): Dear Reader, there are many Linux boards on the market: Bifferboard, NanosG20, Foxboard, Beagleboard, AlixPC, Android phones and tablets, routers, netbooks, and most recently the Raspberry Pi.
How to share data of temperatura from DHT22 over the Internet with Xively. The web has definitely changed many things, such as the availability of data on request, quickly and easily.
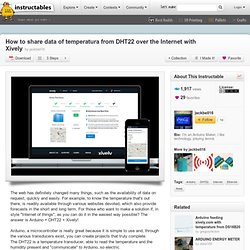
For example, to know the temperature that's out there, is readily available through various websites devoted, which also provide forecasts in the short and long term. For those who want to make a solution if, in style "Internet of things", as you can do it in the easiest way possible? The answer is Arduino + DHT22 + Xively! Arduino, a microcontroller is really great because it is simple to use and, through the various transducers exist, you can create projects that truly complete. Arduino feeding xively.com with temperature from DS18B20.
Web Interface. Plotly + Arduino Data Visualization. Plans and Pricing. Arduino + Processing: Make a Radar Screen to Visualise Sensor Data from SRF-05 – Part 2: Visualising the Data. This is where all the work is done to read an interpret the values from the servo and the sensor.
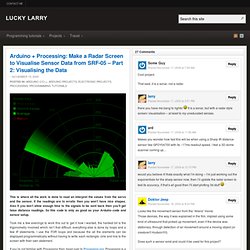
If the readings are to erratic then you won’t have nice shapes. Also if you don’t allow enough time to the signals to be sent back then you’ll get false distance readings. So this code is only as good as your Arduino code and sensor setup. Took me a few evenings to work this out to get it how I wanted, the hardest bit is the trigonometry involved which isn’t that difficult, everything else is done by loops and a few IF statements.
I use the FOR loops alot because the all the elements can be displayed programmatically without having to write each rectangle, cirle and line to the screen with their own statement. If you’re not familiar with Processing then head over to Processing.org. First we have to setup our variables, background and load in the serial port libraries to ensure we can read the data sent by the Arduino. Realtime Graphing of Accelerometer/Gyroscope Data. During my naive days as a university student the only time I graphed data was when some professor required a graph in the lab report.
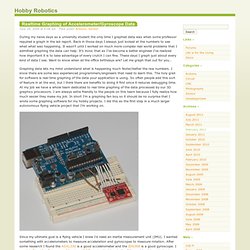
Back in those days I always just looked at the numbers to see what what was happening. It wasn’t until I worked on much more complex real world problems that I admitted graphing the data can help. It’s ironic that as I’ve become a better engineer I’ve realized how important it is to take advantage of every crutch I can fine. These days I graph just about every kind of data I see. Want to know when all the office birthdays are? Graphing data lets my mind understand what is happening much faster/better the raw numbers. Since my ultimate goal is a flying vehicle I knew I’d need an inertia measurement unit (IMU). Plotting Data From Arduino. Visualise microcontroller data with Megunolink Pro. Introduction When the time comes to capture data from a microcontroller-based project, or control an embedded project via a PC – the thought of writing the appropriate PC software can give some people a headache.
Or if you’re an Arduino or other development board user and are frustrated with the Serial Monitor box – where do you go? These problems and many more can be solved by using the Megunolink Pro software that’s the subject of this review. From the Megunolink website, MegunoLink Pro is a tool designed to aid embedded electronics designers. Phil from Megunolink gives us a quick demonstration in the following video: Installation Getting Megunolink running takes around ten minutes. Operation Using Megunolink is quite simple, even though there’s a whole pile of functions.
Furthermore there is an “upload monitor” in Megunolink – which can automatically disconnect from the COM: port used by an Arduino when you need to upload a new sketch, then reconnect afterward. Real-time mapping Conclusion. Arduino data visualization with Plot.ly. Like many Makers, Instructables member Plotlygraphs has used versatile Atmel-based Arduino boards over the years to build everything from MIDI controllers to simple LED flashers.

Recently, Plotlygraphs wrote up a succinct Instructables post that explains how to use plot.ly, a collaborative data analysis and graphing tool, to visualize data from Arduino pins. More specifically, Plotlygraphs pairs an Atmel-powered Arduino Uno (ATmega328) with a DHT22 Temperature + Humidity Sensor to create detailed environmental graphs. Aside from the Uno and DHT, key project specs include an Ethernet shield, hookup wires, angled pin headers, 9v wall adapter, two pieces of (2 1/2″ x 3 1/2″ ) wood (1/4″ thick), four (10-32x2in) machine screws, 12 hex nuts (10-32 diameter).
In terms of software, Makers can download the latest Arduino software (1.0.5), Plot.ly Arduino library and Adafruit’s DHT Arduino Library. The first step? “This design is so simple and wonderful, we’ll leave it up to you! Like this: