
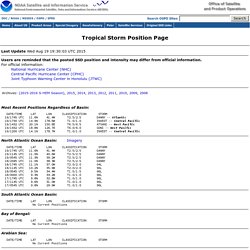
HFIP Experimental Products. Odt04L. Tropical Storm Position Page - Satellite Products and Services Division - Office of Satellite and Product Operations. Last Update Wed Aug 19 19:30:03 UTC 2015 Users are reminded that the posted SSD position and intensity may differ from official information.For official information:
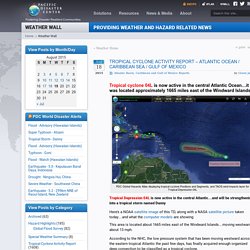
Tropical Cyclone Activity Report – Atlantic Ocean / Caribbean Sea / Gulf of Mexico. Tropical cyclone 04L is now active in the central Atlantic Ocean…it was located approximately 1665 miles east of the Windward Islands PDC Global Hazards Atlas displaying tropical cyclone Positions and Segments, and TAOS wind impacts layer for Tropical Depression 04L Tropical Depression 04L is now active in the central Atlantic…and will be strengthening into a tropical storm named Danny This area is located about 1665 miles east of the Windward Islands…moving westward at about 13 mph.
Historical Hurricane Tracks. Abstract: Collapsing precipitation cores in open-eyewall hurricanes at landfall: Are these cores actually downbursts associated with extreme surface wind gusts? (27th Conference on Hurricanes and Tropical Meteorology) Wednesday, 26 April 2006: 9:30 AM Collapsing precipitation cores in open-eyewall hurricanes at landfall: Are these cores actually downbursts associated with extreme surface wind gusts?

Regency Grand Ballroom (Hyatt Regency Monterey) Jason Holmes, University of South Alabama, Mobile, AL; and K. G. Blackwell, R. Poster PDF (1.6 MB) Hurricanes produce strong winds at landfall, particularly within their eyewalls. Collapsing cores of heavy precipitation appear to be prevalent in many tropical cyclones. Additionally in this study, a numerical model, configured specifically for hurricane research, may be used to provide clues to the source of some of the surface gusts associated with these collapsing cores. Hurricanes in History. Please note that the following list is not exhaustive and does not include every notable storm in history.
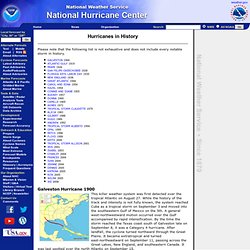
Galveston Hurricane 1900 This killer weather system was first detected over the tropical Atlantic on August 27. While the history of the track and intensity is not fully known, the system reached Cuba as a tropical storm on September 3 and moved into the southeastern Gulf of Mexico on the 5th. A general west-northwestward motion occurred over the Gulf accompanied by rapid intensification. By the time the storm reached the Texas coast south of Galveston late on September 8, it was a Category 4 hurricane. This hurricane was the deadliest weather disaster in United States history. Hurricane / Tropical Data. Hurricane / Tropical Data. Www.cpc.ncep.noaa.gov/products/expert_assessment/hurrsummary_2005.pdf.
DEOS: Current velocities of the Gulf Stream. Last updated automagically: Saturday 7 November 2015 21:58:42 CET Since 21 December 2004 the velocity maps show the absolute in stead of relative velocities.
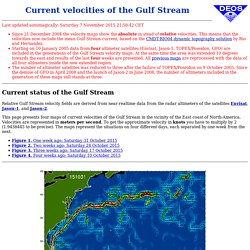
This means that the velocities now include the mean Gulf Stream current, based on the CMDT-RIO04 dynamic topography solution by Rio and Hernandez. Starting on 10 January 2005 data from four altimeter satellites (Envisat, Jason-1, TOPEX/Poseidon, GFO) are included in the generations of the Gulf Stream velocity maps. At the same time the area was extended 10 degrees towards the east and results of the last four weeks are presented. CycloneXtrème - Météo Cyclone Pacifique Sud - Calédonie & Polynésie.
Central Pacific Hurricane Center - Honolulu, Hawai`i. Issued: Aug 13, 2014 8:00 pm HST For the central north Pacific, between 140°W and 180. 1.
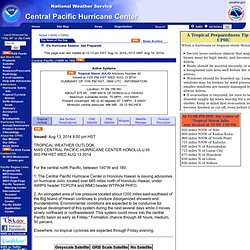
The Central Pacific Hurricane Center in Honolulu Hawaii is issuing advisories on hurricane Julio, located over 665 miles north of Honolulu Hawaii, under AWIPS header TCPCP4 and WMO header WTPA34 PHFO. 2. An elongated area of low pressure located about 1200 miles east-southeast of the Big Island of Hawaii continues to produce disorganized showers and thunderstorms. Elsewhere, no tropical cyclones are expected through Friday evening. Greyscale Satellite GRB Scale Satellite No Satellite. Tropical cyclone ‘maximum intensity’ is shifting toward the poles.
Over the past 30 years, the location where tropical cyclones reach maximum intensity has been shifting toward the poles in both the northern and southern hemispheres at a rate of about 35 miles, or one-half a degree of latitude, per decade according to a new study, The Poleward Migration of the Location of Tropical Cyclone Maximum Intensity, published tomorrow in Nature.
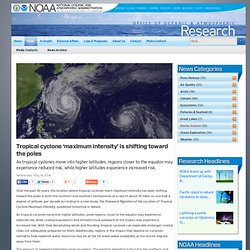
As tropical cyclones move into higher latitudes, some regions closer to the equator may experience reduced risk, while coastal populations and infrastructure poleward of the tropics may experience increased risk. With their devastating winds and flooding, tropical cyclones can especially endanger coastal cities not adequately prepared for them. Additionally, regions in the tropics that depend on cyclones’ rainfall to help replenish water resources may be at risk for lower water availability as the storms migrate away from them. The amount of poleward migration varies by region.
CCAR Ocean Data Viewers.
Www.met.nps.edu/~mtmontgo/MR3252/TM2003_030626.pdf. Hurricane Links. Index of /archdat/atlantic/model_overlays. Key atlantic images. SEASON FORECASTS. Sea surface Temps. Hurricanes - FSU COAPS. On May 30, 2013, COAPS scientists released their fifth annual Atlantic hurricane season forecast.

Hurricane season begins June 1 and runs through Nov. 30. The 2013 forecast called for a 70 percent probability of 12 to 17 named storms, including 5 to 10 hurricanes. The mean forecast was for 15 named storms, including 8 hurricanes, and an average accumulated cyclone energy (a measure of the strength and duration of storms accumulated during the season) of 135. The forecast numbers were based on 50 individual seasonal atmospheric forecasts using sea surface temperatures predicted by a recently upgraded National Oceanic and Atmospheric Administration (NOAA)climate model. Tropical Storm Risk (TSR) for long-range forecasts of hurricane, typhoon and cyclone worldwide. Hurricanes - FSU COAPS. On May 30, 2013, COAPS scientists released their fifth annual Atlantic hurricane season forecast.

Hurricane season begins June 1 and runs through Nov. 30. The 2013 forecast called for a 70 percent probability of 12 to 17 named storms, including 5 to 10 hurricanes. Global Tropical Hazards Assessment. Recent observations of tropical convective anomalies have been more consistent with MJO activity.
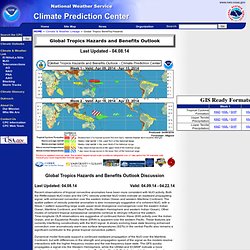
Both the RMM-based MJO index and the CPC velocity potential MJO index indicate an eastward propagating signal, with enhanced convection over the eastern Indian Ocean and western Maritime Continent. The spatial pattern of velocity potential anomalies is also increasingly suggestive of a coherent MJO, with a Wave-1 pattern supporting large scale upper-level divergence (convergence) over the eastern Indian Ocean, Maritime Continent, and West Pacific (Western Hemisphere and western Indian Ocean).
Other modes of coherent tropical subseasonal variability continue to strongly influence the pattern. Time-longitude OLR observations are suggestive of continued Kelvin Wave (KW) activity over the Indian Ocean, and an Equatorial Rossby Wave (ERW) is apparent over the western Pacfic. These features are currently interfering constructively with the MJO signal. Www.rsmas.miami.edu/assets/pdfs/upper-ocean-dynamics/2010waf_Rappaport.pdf. Blended TPW Product Animation Links - OSPO. NexSat, NRL/JPSS Next-Generation Weather Satellite Demonstration Project.
NexSat, NRL/JPSS Next-Generation Weather Satellite Demonstration Project.
That Hurricane Guy's Storm Composite. NOAA Doppler Radar Weather Channel Oceanweather Inc. Current Marine Data. Hurricane & Tropical Storm Updates. Tropical Weather... Done Better!™ Central Florida Hurricane Center 2014 - Since 1995. HURRICANEHOLLOW.ORG. Tropical Atlantic/EactPac Satellite Sectors. Crown Weather Services - Your One-Stop Weather Information Source. Tropical Cyclone Model & Best Track Archive: Current Storms. The current position and intensity of any storm on this page does not come from the latest advisory from the National Hurricane Center (NHC) for the Atlantic and East Pacific basins or the Central Pacific Hurricane Center (CPHC) for the Central Pacific basin. For this important data you must refer to the agency responsible for issuing forecasts in the particular basin you are looking at. The current position and intensity on this page is provided to show what data the early cycle models initialized with. An invest area, noted with a number from 90 to 99, represents an area that is being watched for possible development.
Tropical Center: Latest Tropical Activity. * Live Weather Images * weatherimages.org. Quick Links. Hurricane Spaghetti Models / Spaghetti Charts / Tropical Forecast / Hurricane Charts Models / Tropical Update. Hurricane Links and Computer Models. Hurricane Tracking and Hurricane coverage from MyFoxHurricane.com.