
Webinar Discussions. Here, you’ll find links to the archived webinars referenced in Data Literacy in the Real World: Conversations and Case Studies. 1.

Thursday, July 14, 9:00am – 10:15am Eastern“But It’s a Number, So It Has To Be True!” : An Introduction to Data Literacy, Part I Presented by Lynette Hoelter, Interuniversity Consortium for Political and Social Research, University of Michigan, Ann Arbor, MI Data literacy is about asking questions as one encounters numerical information in popular and scientific media. Numbers can be as fallible as any other source of information. VariablesAveragesPercentages, percentiles, and percent change Attendees will acquire the tools needed to begin similar conversations with students.
Assessment Literacy. Three Free Tools for Creating Data Visualizations. Last night I shared the news about Canva's new education site that offers lesson plans the incorporate creating visual representations of information.

Confusing Stats Terms Explained: Internal Consistency — Stats Make Me Cry. Internal consistency is typically measured using Cronbach's Alpha (α).
Cronbach's Alpha ranges from 0 to 1, with higher values indicating greater internal consistency (and ultimately reliability). Common guidelines for evaluating Cronbach's Alpha are: .00 to .69 = Poor.70 to .79 = Fair .80 to .89 = Good .90 to .99 = Excellent/Strong. Chi-Square Test of Independence. This lesson explains how to conduct a chi-square test for independence.
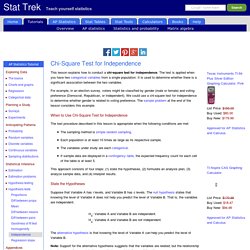
The test is applied when you have two categorical variables from a single population. It is used to determine whether there is a significant association between the two variables. For example, in an election survey, voters might be classified by gender (male or female) and voting preference (Democrat, Republican, or Independent). We could use a chi-square test for independence to determine whether gender is related to voting preference.
The sample problem at the end of the lesson considers this example. Standard Deviation and Variance. Deviation just means how far from the normal Standard Deviation The Standard Deviation is a measure of how spread out numbers are.
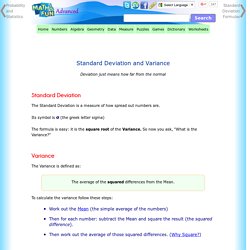
Its symbol is σ (the greek letter sigma) The formula is easy: it is the square root of the Variance. DataLab. New York this week became the 10th state (plus D.C.) to join the National Popular Vote Interstate Compact.

The compact represents a clever workaround to the Electoral College. By signing on, states agree they will award their electoral votes to the winner of the national popular vote (for example, New York would have given its electoral votes to George W. Bush in 2004). However, the measure will only be triggered once states accounting for a majority of electoral votes have joined.
There are 538 electoral votes (hence the name of this website), so a majority is 270. Here’s the problem: All the states to have joined so far are very blue. As the chart below indicates, the relationship between whether a state has joined the compact and how it voted in 2012 is nearly 1-to-1. Perhaps the compact can get Delaware, Connecticut and Maine to join, where Obama also won by 15 percentage points or more. Soon after comes outright swing states, such as Ohio, New Hampshire and Colorado. Z Scores and T Scores. Z Scores A Z score (also known as a z value, standard score, and normal score) is used to describe a particular score in terms of where it fits into an overall group of scores.
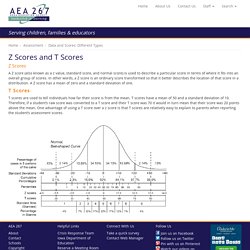
In other words, a Z score is an ordinary score transformed so that it better describes the location of that score in a distribution. A Z score has a mean of zero and a standard deviation of one. T Scores T scores are used to tell individuals how far their score is from the mean. Tutorials. How to Make a State Grid Map in R Something of a cross between a reference table and a map, the state grid provides equal space to each state and a semblance of the country to quickly pick out individual states.
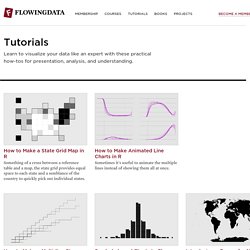
How to Make Animated Line Charts in R Sometimes it's useful to animate the multiple lines instead of showing them all at once. Let's Talk Data: 22 SXSWedu Sessions Getting It Right. Using_Student-involved_assessmentpdf.pdf. Reversing course on controversial PARCC, CPS to test all students. CPS back-tracked on its previous stance on Monday, saying it will give the new PARCC exam to all students instead of just those students in 10 percent of schools.

Meanwhile, parents are setting in motion a major opt-out campaign a week before the March 9 date on which testing is scheduled to begin. (Schools have 20 days to give the test.) The district’s decision was perhaps a foregone conclusion since the state announced that up to $1.4 billion in state and federal funding was at stake CPS didn’t test its students on the new state-mandated test, which is becoming increasingly controversial across the country. Illinois risked losing federal funds if it didn’t test 95 percent of students in the state, impossible if CPS gave the test in just a small sample of schools.
“We cannot accept this risk,” School Board President David Vitale said Monday. Officials had also said the district didn’t have the technical capacity to administer the computer-based PARCC, developed by a consortium of states. Measurement and Assessment in Teaching, 10/e. Learning Objectives. The Teaching Profession in 2014 (in Charts) - Teaching Now. What is Silk? UTRU_Assessment_and_Data_Literacy_Scope_and_Sequenceccssocover.pdf. Data Inventory. Sample Data Sets. There's so much data out there, sometimes it's tough to know where to start.
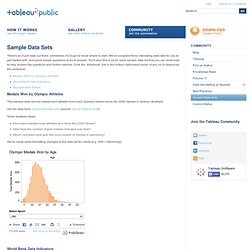
We've compiled three interesting data sets for you to get started with, and some simple questions to try to answer. You'll also find a viz for each sample data set that you can download to help answer the questions and further explore. Click the ‘download’ link in the bottom right-hand corner of any viz to download the workbook. Medals Won by Olympic Athletes This sample data set has medals and athletes from each Olympic Games since the 2000 Games in Sydney, Australia.
Get the data here: OlympicAthletes.xlsx (source: Sports Reference) Some analysis ideas: How many medals have athletes won since the 2000 Games? ELSI - Elementary and Secondary Information System.