
@Totango. Totango. Export or other. Porter's Five Forces Model: analysing industry structure. Author: Jim Riley Last updated: Sunday 23 September, 2012 Overview of the Five Forces Model Porter identified five factors that act together to determine the nature of competition within an industry.

These are the: Threat of new entrants to a market Bargaining power of suppliers Bargaining power of customers (“buyers”) Threat of substitute products Degree of competitive rivalry He identified that high or low industry profits (e.g. soft drinks v airlines) are associated with the following characteristics: Let’s look at each one of the five forces in a little more detail to explain how they work. Threat of new entrants to an industry If new entrants move into an industry they will gain market share & rivalry will intensify The position of existing firms is stronger if there are barriers to entering the market If barriers to entry are low then the threat of new entrants will be high, and vice versa Barriers to entry are, therefore, very important in determining the threat of new entrants.
BCG Matrix. Strategic Management > BCG Matrix The BCG Growth-Share Matrix The BCG Growth-Share Matrix is a portfolio planning model developed by Bruce Henderson of the Boston Consulting Group in the early 1970's.
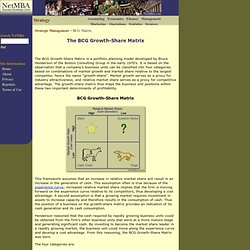
It is based on the observation that a company's business units can be classified into four categories based on combinations of market growth and market share relative to the largest competitor, hence the name "growth-share". Product portfolio - the Boston Matrix (or Boston Box) Author: Jim Riley Last updated: Sunday 23 September, 2012 Introduction to the Boston Matrix A business with a range of products has a portfolio of products.

However, owning a product portfolio poses a problem for a business. It must decide how to allocate investment (e.g. in product development, promotion) across the portfolio. Graphic Organizers. Exploratree - Exploratree by FutureLab. Pie chart. Pie chart of populations of English native speakers Pie charts are very widely used in the business world and the mass media.[3] However, they have been criticized,[4] and many experts recommend avoiding them,[5][6][7][8] pointing out that research has shown it is difficult to compare different sections of a given pie chart, or to compare data across different pie charts.
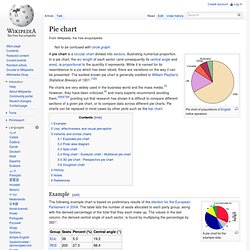
Pie charts can be replaced in most cases by other plots such as the bar chart. Example[edit] A pie chart for the example data. The following example chart is based on preliminary results of the election for the European Parliament in 2004. T chart. Y chart. Venn diagram. SiD Life Cycle Rocket: Symbiosis in Design: Except Consultancy. Flowchart Software - Online Flow charts software service with Realtime collaboration [2.4-r35, updated 2011/09/06 10:19 UTC] Cacoo - Create diagrams online Real time collaboration. The Six Thinking Hats–my way of remembering them. The six hats introduce a way to do parallel thinking!

I have summarised the six hats here and used my own imagination to produce my own version of how I like to think of the six hats: 1) White hat-Data. Little's law. The long-term average number of customers in a stable system L is equal to the long-term average effective arrival rate, λ, multiplied by the (Palm‑)average time a customer spends in the system, W; or expressed algebraically: L = λW.
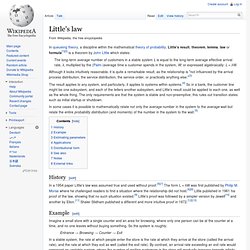
Although it looks intuitively reasonable, it is quite a remarkable result, as the relationship is "not influenced by the arrival process distribution, the service distribution, the service order, or practically anything else. "[3] The result applies to any system, and particularly, it applies to systems within systems.[4] So in a bank, the customer line might be one subsystem, and each of the tellers another subsystem, and Little's result could be applied to each one, as well as the whole thing. Collaboration. Diagrams & charts tools. Gantt chart. A Gantt chart showing three kinds of schedule dependencies (in red) and percent complete indications.
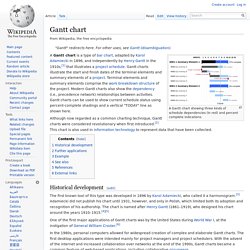
Although now regarded as a common charting technique, Gantt charts were considered revolutionary when first introduced.[2] This chart is also used in information technology to represent data that have been collected. Historical development[edit] The first known tool of this type was developed in 1896 by Karol Adamiecki, who called it a harmonogram.[3] Adamiecki did not publish his chart until 1931, however, and only in Polish, which limited both its adoption and recognition of his authorship. The chart is named after Henry Gantt (1861–1919), who designed his chart around the years 1910–1915.[4][5] In the 1980s, personal computers allowed for widespread creation of complex and elaborate Gantt charts.
Further applications[edit] There are many computer applications supporting the use of Gantt charts for employee scheduling. Business Hat - News. By Nate | April 26, 2011 | 72 comments I love to wear my engineering hat.
But over the years I've had to learn (sometimes kicking and screaming) about business. Somewhere along the path I started to enjoy it so forgive me if I sometimes put on my business toupee (after all, I really shouldn't be running a business). SparkFun lived in a series of places over the past 8 years. Towards the beginning, I was like any other college student – I had roommates.
I always like eye candy so here's a breakdown and timeline of some of the major events. 1. From our About Us page: SparkFun was founded in 2003 by CEO Nathan Seidle, then a University of Colorado - Boulder engineering student. When did it start? Our size? 2. This is a really hard question! How big do we want to be? 3. What do you say about what is available for purchase?
What if there is a problem? Who are our customers? 4. SparkFun-OrgChart-2011-03-16. SparkFun-Timeline-Spring2011.jpg (JPEG Image, 1624×956 pixels) - Scaled (77%)