
Bluetooth® Technology Website. Filter Design and Implementation (Signal Processing Toolbox™) Mattutorial. Button customization. Matlab’s button uicontrols (pushbutton and togglebutton) are basically wrappers for a Java Swing JButton object.

This will be the first in a series of posts showing how Matlab uicontrols can be customized in ways that you may never have thought possible. Probably the simplest undocumented customization is the control’s acceptance of HTML and CSS Strings: tooltip = '<html>HTML-aware<br><b>tooltips</b><br><i>supported'; labelTop= '<HTML><center><FONT color="red">Hello</Font><b>world</b>'; labelBot=['<div style="font-family:impact;color:green"><i>What a</i>'... ' <Font color="blue" face="Comic Sans MS">nice day!
']; set(hButton, 'tooltip',tooltip, 'string',[labelTop '<br>' labelBot]); Button with HTML label and tooltip For more powerful customization, we need to access the control’s underlying JList object. >> jButton = java(findjobj(hButton)) jButton = com.mathworks.hg.peer.PushButtonPeer$1[,0,0,...] How to Customize and Improve MATLAB Figures for Publication. In this post I will be showing how to produce a publication quality figure using MATLAB (2007a).
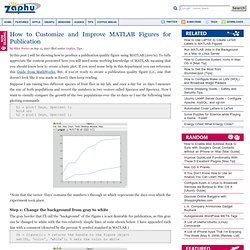
To fully appreciate the content presented here you will need some working knowledge of MATLAB, meaning that you should know how to create a basic plot. If you need some help in this department you can reference this Guide from MathWorks. But, if you’re ready to create a publication quality figure (i.e., one that doesn’t look like it was made in Excel), then keep reading. Suppose I am raising two different species of fruit flies in my lab, and once a day for 10 days I measure the size of both populations and record the numbers in two vectors called Species1 and Species2.
Now I want to visually compare the growth of the two populations over the 10 days so I use the following basic plotting commands h1 = plot( Days, Species1 ); hold on; h2 = plot( Days, Species2 ); *Note that the vector ‘Days’ contains the numbers 1 through 10 which represents the days over which the experiment took place. Creating Movies in MATLAB. Carl Scarrott This set of instructions detail how to create movies in MATLAB 5.1, convert them to the standard movie format MPEG and how to play them.
Limited knowledge of MATLAB or the MPEG format is assumed. This code has not been verified for any other MATLAB version. How to create MATLAB movies. How to parse a string? (Simple question) - comp.soft-sys.matlab. Importing Text Data Files - MATLAB & Simulink Example. You can import text files into MATLAB® both interactively and programmatically.
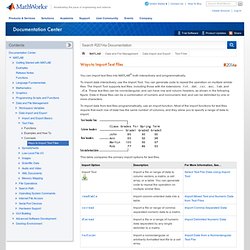
To import data interactively, use the Import Tool. You can generate code to repeat the operation on multiple similar files. The Import Tool supports text files, including those with the extensions .txt, .dat, .csv, .asc, .tab, and .dlm. These text files can be nonrectangular, and can have row and column headers, as shown in the following figure. Data in these files can be a combination of numeric and nonnumeric text, and can be delimited by one or more characters. To import data from text files programmatically, use an import function. Blinkdagger. MATLAB GUI Tutorial - For Beginners. Why use a GUI in MATLAB? The main reason GUIs are used is because it makes things simple for the end-users of the program.
If GUIs were not used, people would have to work from the command line interface, which can be extremely difficult and fustrating. Imagine if you had to input text commands to operate your web browser (yes, your web browser is a GUI too!). It wouldn’t be very practical would it? In this tutorial, we will create a simple GUI that will add together two numbers, displaying the answer in a designated text field. This tutorial is written for those with little or no experience creating a MATLAB GUI (Graphical User Interface). Contents Initializing GUIDE (GUI Creator) First, open up MATLAB. You should see the following screen appear. You should now see the following screen (or something similar depending on what version of MATLAB you are using and what the predesignated settings are): Creating the Visual Aspect of the GUI: Part 1. MATLAB Graphics.
MATLAB graphics can help you see the big picture in your data.
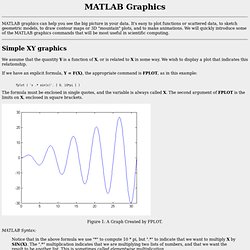
It's easy to plot functions or scattered data, to sketch geometric models, to draw contour maps or 3D "mountain" plots, and to make animations. We will quickly introduce some of the MATLAB graphics commands that will be most useful in scientific computing. Simple XY graphics We assume that the quantity Y is a function of X, or is related to X in some way.
We wish to display a plot that indicates this relationship. If we have an explicit formula, Y = F(X), the appropriate command is FPLOT, as in this example: fplot ( 'x .* sin(x)', [ 0, 10*pi ] ) The formula must be enclosed in single quotes, and the variable is always called X. Figure 1: A Graph Created by FPLOT. MATLAB - Documentation. POWER SPECTRAL DENSITY FUNCTION.