
Research.stowers-institute.org/efg/R/Color/Chart/ColorChart.pdf. +opts() List · hadley/ggplot2 Wiki. R graphics plot gallery - plots, charts and graphs with R code. R has great graphics and plotting capabilities and can produce a wide range of plots very easily.
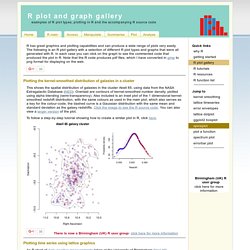
The following is an R plot gallery with a selection of different R plot types and graphs that were all generated with R. In each case you can click on the graph to see the commented code that produced the plot in R. Note that the R code produces pdf files, which I have converted in gimp to png format for displaying on the web. This shows the spatial distribution of galaxies in the cluster Abell 85, using data from the NASA Extragalactic Database (NED).
Producing Simple Graphs with R. Announcing RPubs: A New Web Publishing Service for R « RStudio Blog. Today we’re very excited to announce RPubs, a free service that makes it easy to publish documents to the web from R.

RPubs is a quick and easy way to disseminate data analysis and R code and do ad-hoc collaboration with peers. RPubs documents are based on R Markdown, a new feature of knitr 0.5 and RStudio 0.96. To publish to RPubs within RStudio, you simply create an R Markdown document then click the Publish button within the HTML Preview window: RPubs documents include a moderated comment stream for feedback and dialog with readers, and can be updated with changes by publishing again from within RStudio.