
Exploring Expressions of Emotions in GitHub Commit Messages. Last week GitHub announced that the data collected over at the GitHub Archive was made available as a public dataset on Google's BigQuery web service.
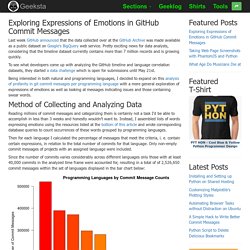
Pretty exciting news for data analysts, considering that the timeline dataset currently contains more than 7 million records and is growing quickly. To see what developers come up with analyzing the GitHub timeline and language correlation datasets, they started a data challenge which is open for submissions until May 21st. Being interested in both natural and programming languages, I decided to expand on this analysis of profanity in git commit messages per programming language with a more general exploration of expressions of emotions as well as looking at messages indicating issues and those containing swear words. Getting started with R Markdown. Collaboration and time travel: version control with git, github and RStudio - 48:56. Getting started with R and RStudio. A Tour through the Visualization Zoo. The July/August issue of acmqueue is out nowSubscribers and ACM Professional members login here Graphics Jeffrey Heer, Michael Bostock, and Vadim Ogievetsky, Stanford University Thanks to advances in sensing, networking, and data management, our society is producing digital information at an astonishing rate.
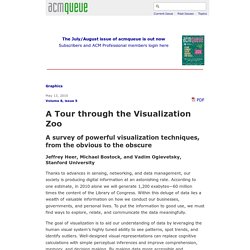
According to one estimate, in 2010 alone we will generate 1,200 exabytes—60 million times the content of the Library of Congress. Within this deluge of data lies a wealth of valuable information on how we conduct our businesses, governments, and personal lives. The goal of visualization is to aid our understanding of data by leveraging the human visual system's highly tuned ability to see patterns, spot trends, and identify outliers. Creating a visualization requires a number of nuanced judgments. This article provides a brief tour through the "visualization zoo," showcasing techniques for visualizing and interacting with diverse data sets. Unit 3_Modeling Expert_Video 1. MIT15071XT114-G010401_100. MIT15071XT114-G010302_100.
MIT15071XT114-G010201_100. MIT15071XT114-G0101_100. Unit 2_Moneyball_Video 6. Unit 2_Moneyball_Video 5. Unit 2_Moneyball_Video 4. MIT15071XT114-M0102_100. MIT15071XT114-M010101_100. MIT15071XT114-M0106_100. Baseball Rules Whiteboard Video Rules of Baseball. Unit 2_Wine Quality_Video 8. MIT15071XT114-W010301_100. MIT15071XT114-W0102_100. MIT15071XT114-W0101_100. Unit 2_Wine Quality_Video 4. Unit 2_Wine Quality_Video 2. Unit 2_Wine Quality_Video 1. Discover Feature Engineering, How to Engineer Features and How to Get Good at It.
Feature engineering is an informal topic, but one that is absolutely known and agreed to be key to success in applied machine learning.
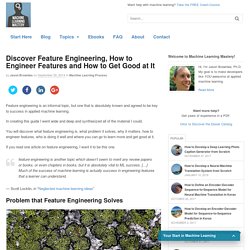
In creating this guide I went wide and deep and synthesized all of the material I could. You will discover what feature engineering is, what problem it solves, why it matters, how to engineer features, who is doing it well and where you can go to learn more and get good at it. If you read one article on feature engineering, I want it to be this one. feature engineering is another topic which doesn’t seem to merit any review papers or books, or even chapters in books, but it is absolutely vital to ML success. […] Much of the success of machine learning is actually success in engineering features that a learner can understand. — Scott Locklin, in “Neglected machine learning ideas” Problem that Feature Engineering Solves Feature engineering is hard. This includes getting the best results from the algorithms you are using. Importance of Feature Engineering Books. Uber Is Serving New York’s Outer Boroughs More Than Taxis Are.
The recent debate between Uber and New York City Mayor Bill de Blasio over whether the ride-for-hire company was exacerbating Manhattan congestion was fueled by incomplete, misleading data.

There was no way of knowing exactly where Uber cars and taxis pick up passengers, and so the city agreed to a study of Uber’s effects last month as part of its detente with the company. Now, thanks in part to a Freedom of Information Law request, we have data. A lot of data: nearly 93 million trips taken by Uber and conventional taxis over a six-month period from April to September last year, including date, time and coordinates of the pickups. And while we can’t yet say whether Uber has exacerbated Manhattan congestion, the data we’ve analyzed shows that Uber has a point when it claims that it is doing a better job than taxis in serving the boroughs of New York City outside of Manhattan. The city, though, has a point when it says that most of Uber’s trips are in the city’s busiest areas. Common Probability Distributions: The Data Scientist's Crib Sheet - Cloudera Engineering Blog.
Data scientists have hundreds of probability distributions from which to choose.
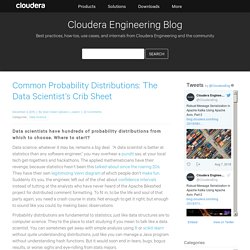
Where to start? Data science, whatever it may be, remains a big deal. “A data scientist is better at statistics than any software engineer,” you may overhear a pundit say, at your local tech get-togethers and hackathons. The applied mathematicians have their revenge, because statistics hasn’t been this talked-about since the roaring 20s. They have their own legitimizing Venn diagram of which people don’t make fun. Probability distributions are fundamental to statistics, just like data structures are to computer science. There are hundreds of probability distributions, some sounding like monsters from medieval legend like the Muth or Lomax. Now, What’s a Probability Distribution? Tidy data. Hadley Wickham.
Tidy data. The Journal of Statistical Software, vol. 59, 2014. Online regex tester and debugger: PHP, PCRE, Python, Golang and JavaScript. Exploring Expressions of Emotions in GitHub Commit Messages. Exploring Expressions of Emotions in GitHub Commit Messages. Regular Expressions. Titanic: Machine Learning from Disaster. d3-media: HOW TO REFINE YOUR DATA. NOTE: we can UNDO and REDO our operation in the left of the screen!

7. To see the result of our work: do the following:create a text facet for company; highlight Philips and you see all the product, numbers etc for Philips.Create a text facet for product and you see the orders for the products. 8. Close the facets. Now lets look at the last column, names. Value.replace(“mevr, “f”)Split the column name into 2. using space as separator. 9. Cells["address"].value + ", " + cells["city"].value name this column geocodeNext add the country to a new column columns and call the column geocode 2 cells["geocode"].value + ", " + cells["country"].value In geocode 2 we have all information needed for geocoding; delete the columns city, country, address and geocode. 10.
Going deeper with dplyr: New features in 0.3 and 0.4 (video tutorial) March 8, 2015 · R tutorial In August 2014, I created a 40-minute video tutorial introducing the key functionality of the dplyr package in R. dplyr continues to be my "go-to" package for data exploration and manipulation because of its intuitive syntax, blazing fast performance, and excellent documentation.
I recorded that tutorial using the latest version at the time (0.2), but there have since been two significant updates to dplyr (versions 0.3 and 0.4). Because those updates introduced a ton of new functionality, I thought it was time to create another tutorial! This new tutorial covers the most useful new features in 0.3 and 0.4, as well as some advanced functionality from previous versions that I didn't cover last time. (If you have not watched the previous tutorial, I recommend you do so first since it covers some dplyr basics that are not covered in this tutorial.) The video is embedded below, or you can view it on YouTube: Hands-on dplyr tutorial for faster data manipulation in R. August 25, 2014 · R tutorial I love dplyr.
It's my "go-to" package in R for data exploration, data manipulation, and feature engineering. I use dplyr because it saves me time: its performance is blazing fast on data frames, but even more importantly, I can write dplyr code faster than base R code. Its syntax is intuitive and its functions are well-named, and so dplyr code is easy-to-read even if you didn't write it. dplyr is the "next iteration" of the plyr package (focusing data frames, hence the "d"), and released version 0.1 in January 2014. Style guide · Advanced R. Good coding style is like using correct punctuation.
You can manage without it, but it sure makes things easier to read. As with styles of punctuation, there are many possible variations. The following guide describes the style that I use (in this book and elsewhere). It is based on Google’s R style guide, with a few tweaks. Quick-R: Home Page. Rseek.org - rstats search engine.
Students. The swirl R package makes it fun and easy to learn R programming and data science. If you are new to R, have no fear. On this page, we’ll walk you through each of the steps required to begin using swirl today! Step 1: Get R In order to run swirl, you must have R 3.1.0 or later installed on your computer. If you are on a Linux operating system, please visit our Installing swirl on Linux page. If you need to install R, you can do so here. For help installing R, check out one of the following videos (courtesy of Roger Peng at Johns Hopkins Biostatistics): Step 2 (recommended): Get RStudio. Big Data A to Z: A glossary of Big Data terminology – Big Data Made Simple. This is almost a complete glossary of Big Data terminology widely used today. Data Science Glossary.