
Modern BI Architecture & Analytical Ecosystems. London. City Dashboard: Aggregating All Spatial Data for Cities in the UK. CityDashboard [citydashboard.org] aggregates various spatial data of about 8 different cities around the UK, and displays this data on a dashboard and a map.
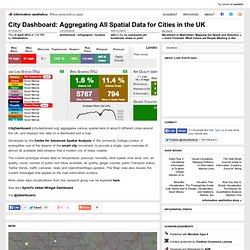
Developed by the Centre for Advanced Spatial Analysis of the University College London, it exemplifies one of the dreams of the smart city movement: to provide a single, open overview of almost all available data streams that a modern city of today creates. The current prototype shows data on temperature, pressure, humidity, wind speed, river level, rain, air quality, mood, number of public rent bikes available, air quality, geiger counter, public Transport status, Twitter trends, traffic cameras, news and OpenStreetMaps updates.
The 'Map' view also reveals the current messages that appear on the road information screens. More urban data visualizations from this research group can be explored here. See also Sprint's Ueber-Widget Dashboard. Dundas Data Visualization Support Site.