
Goldman Sachs is out with a new report on S&P 500 foreign revenue based on 10K filings for the first quarter of 2013 and 2012.
Foreign revenue increase has helped firms boost their top line overall in 2012. The biggest winner according to the report …. energy based companies. A brief summary followed by the full report below: S&P 500 Foreign Revenue Uncertain growth in Asia and Europe combined with FX concerns have supported stocks with high US sales relative to firms with high international revenue exposure so far in 2013. Consensus expectations for 2013 sales and earnings growth support the recent outperformance of domestically-exposed stocks but 2014 estimates are stronger for firms with higher international exposure.
S& P Earnings: 1960-Current — pages.stern.nyu.edu — Readability. Bespoke Investment Group - Think BIG - Final 2010 Global Market Performance. HSCEI - Index Constituents. Indexvergleich für Aktien China. Investment Guide jetzt teilen Wie investiere ich in chinesische Aktien?
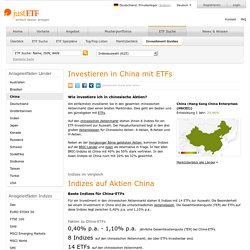
Am einfachsten investieren Sie in den gesamten chinesischen Aktienmarkt über einen breiten Marktindex. Dies geht am besten und am günstigsten mit ETFs. Auf den chinesischen Aktienmarkt stehen Ihnen 8 Indizes für ein ETF-Investment zur Auswahl. Hang Seng Indexes. Indexvergleich für Aktien China. Who Owns Stocks? It’s Not Just the Rich - Real Time Economics - WSJ. "The Wasteland" - How Central Planning Broke All Markets... And W. In his latest ruminations in ruination, Diapason's Sean Corrigan does nothing short of a brilliant post-modernist collage of all the fragments of our broken economic reality and capital markets which, just like the defining 20th century poem by TS Eliot (further exemplified by the Flesch-Kincaid reading complexity of Max+1 inherent in both works), summarizes the terminal situation that we currently find ourselves in.
And while in The Waste Land, Eliot focused more on the existential breakdown of society in the "entre deux guerres" period, Corrigan does the same for the trader/financial archetype of the 21st century. But all is not lost. Must read from Sean Corrigan. Stock Market Predicts The Next US President. I have always wondered whether there is a link between the stock market and the US Presidential election result.
Can the markets in any way “predict” who will be the next US president before the US election result in November? Well, if history repeats, it seems there is a “statistical” way that we can predict who will be the next US president. Before I go any further, let me say that I am NOT political and I have absolutely NO biases or affiliations to ANY political party. It does not matter to me who wins the next election. I made my own personal views known a year ago as to who I believe REALLY rules the World and America. Rosenberg Presents The Three Ways Bernanke Disappointed The Market, And Why. With everyone chiming in with their take on Operation Twist, here is one of the few actually worthy ones on the matter.
From David Rosenberg First, the Fed once again downgraded its outlook on the economy, citing "significant downside risks" (the word "significant" was not there on August 9th) and added "strains in global financial markets" as one of the reasons for the more downbeat assessment. If there hadn't been so many trial balloons being floated in recent weeks over the prospect of an Operation Twist ("OT") style of policy easing, perhaps the stock market would have rallied as it did in rather dramatic fashion six weeks ago. Guest Post: Where Is This Market Headed? Submitted by MacroStory.com Where Is This Market Headed?

“He observed that human emotions collectively had major impacts on the movement of stock prices and Markets in general, ultimately creating patterns that kept repeating.” - From a book on Jesse Livermore's trading style. Markets at major inflection points are more a function of investor psychology and less technicals and or macro data. The struggle between bull and bear, greed and fear will always play a major role in the success and failure of investors. As Jesse Livermore discusses these struggles are a reflection of human emotions and since human emotion never changes they leave patterns that are repeated. Up until now the 2007 topping pattern was a spot on comparison.
Market And Economic Indicators- Macro Story. A weekly update of market and economic indicators across various asset classes.
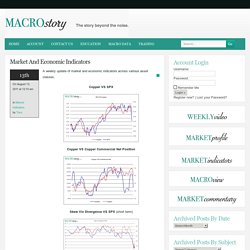
Copper VS SPX Copper VS Copper Commercial Net Position Skew Vix Divergence VS SPX (short term) Skew Vix Divergence VS SPX (long term) Margin Debt VS SPX 30 Year Treasury Yield VS SPX. Post «Bridgewater Warns Low Volatility Markets "Sow The Seeds Of Their Own Demise"» in blog Zero Hedge. Excerpted from Bridgewater's recent market letter, Market movements are driven by how conditions transpire in relation to what is discounted, leading to big moves when conditions are different than what was discounted and small moves when they are similar.
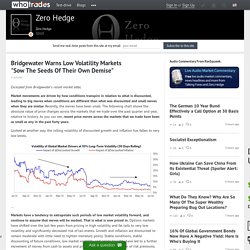
Recently, the moves have been small. Is the Stock Market Cheap?
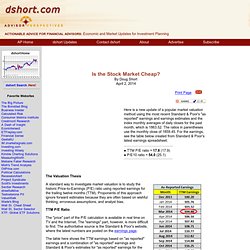
By Doug Short April 2, 2014 Here is a new update of a popular market valuation method using the most recent Standard & Poor's "as reported" earnings and earnings estimates and the index monthly averages of daily closes for the past month, which is 1863.52. The ratios in parentheses use the monthly close of 1859.45. Shiller P/E Ratio: Where Are We with Market Valuations? Date: Sat, 31 Jan 2015 21:42:54 -0600 (Updated every 10 minutes) Shiller P/E: 26.7 ( -1.30%) Shiller P/E is 60.8% higher than the historical mean of 16.6 Implied future annual return: 0.5%Historical low: 4.8 Historical high: 44.2S&P 500: 1994.99Regular P/E: 20 (historical mean: ) Prof.

S& P Earnings: 1960-Current — pages.stern.nyu.edu — Readability. The Market Is STILL 48-60% Overvalued. Bespoke Investment Group - Think BIG - Final 2010 Global Market Performance. Helping to mitigate corrections have been the steady uptrends in the forward earnings of the S&P 500/400/600 to new record highs. Forward earnings did it again last week. What is different this time is that estimates for 2015 have stopped falling. Over the past three years, annual estimates mostly fell, yet forward earnings moved higher because the coming years’ estimates remained higher than the current years’ estimates. In calculating forward earnings, the former get more weight and the latter get less weight as time passes. Another positive is that S&P 500 forward revenues remains on an upward trend and rose to a new high during the week of July 3.
The Economist. The US Consumer is Vital for Equity Markets - Market Views. Stewart Richardson Chief Investment Officer We were somewhat bemused when the Fed upgraded their assessment of the US economy at their FOMC meeting last week. Events must have occurred between December and January for them to announce this upgrade and it can only be because they expect the consumer to spend the “tax cut” from lower energy prices. They may also believe that employment gains will continue despite news flow from the corporate sector that would indicate otherwise. At the moment, we see two competing forces within the US economy.
On the one hand, the consumer and non-energy corporate sector are much better off because of lower energy prices. There are enough commentators that argue whether Fed policies have created a financial bubble. Wonkmonk sur Twitter : "Wall Street Strategists Expect Stocks to Keep Climbing in 2015. S&P 500 Blew the Top Off Wall Street’s Expectations in 2014 - MoneyBeat. Zertifikate - Vergleich - Aktienanleihe - Bonus - Discount - Zertifikat - O. Stock Market Capitalization - All Countries - Quandl. Viele Anleger sehen Schwellenländer-Börsen als homogene Gruppe. Wie ein Blick auf die Tabelle der Börsen mit der besten und der schlechtesten Entwicklung im Jahr 2014 zeigt, sieht die Realität anders aus. In ihr sind auch Industrieländer-Märkte enthalten, Indizes von Emerging-Markets dominieren sie aber (vgl.
Grafik). Mit Anlagen in manche Schwellenländer-Aktienindizes haben Investoren in diesem Jahr viel Geld verdient, mit anderen viel verloren – die Spanne reicht von dem 68%igen Plus des argentinischen Merval-Indexes bis zum Minus von 22,8%, das der russische RTS-Index verbucht hat. Die Entwicklung ist jeweils in Franken gerechnet. Aus Sicht von Nanette Hechler Fayd'herbe von der Credit Suisse (CS) sind vor allem zwei Faktoren für die unterschiedliche Entwicklung der Schwellenländer-Börsen verantwortlich. Beim Blick auf die Rangliste sticht das starke Plus der argentinischen Börse ins Auge. Eine sehr starke Entwicklung zeigte 2014 bisher auch die ägyptische Börse. The Economist. Stock Market Capitalization - All Countries - Quandl. The Market Is STILL 48-60% Overvalued.