
TagCrowd: make your own tag cloud from any text. Tagxedo - Word Cloud with Styles. Inkscape. Draw Freely. Many Eyes. Draw Diagrams Online using Collaborative Diagram Tools. Online Charts Builder. Hohli Online Charts Builder New version: Try new version of Charts Builder, it based on new Google Charts API Load From Image URL: Chart Data can't equal to original, but very similar to it.

Only for images on chart.apis.google.com Chart Type: 3D Pie charts Lines Bar charts Pie charts For Pie Charts with labels choose 1000x300 or 800x375 size Venn diagrams Scatter plots Radar charts Chart Size: 320x240 Horizontal 1000x300 800x375 600x500 320x240 Vertical 300x1000 375x800 500x600 240x320 Square 546x546 400x400 300x300 200x200 Chart Ads: Data: Should be consists only positive numbers, use minus one (-1) for missing value, separated by coma, space or semi(,; ), e.g.: 23, 432, 456, 341 For Lines (pairs): Input data as x-axis and y-axis coordinates, e.g.: x1,y1, x2,y2, x3,y3 Title: Use a pipe character (|) to force a line break in title.
Background: Chart is ready you can save it as image Right click on the chart Select "Save image as" Save the image to your computer © 2011 Charts Builder. Developed by Anton Shevchuk. Interactive maps and visualizations. Easel.ly. Home. Ahead. 40 Useful and Creative Infographics. Six Revisions Menu Main Categories CSS HTML JavaScript Web Design WordPress Web Development Design Inspiration UX Design UI Design Freebies Tutorials Tools Links About Contact Advertise RSS Twitter Facebook 40 Useful and Creative Infographics By Jacob Gube Information graphics (or infographics) are graphical depictions of data and information.
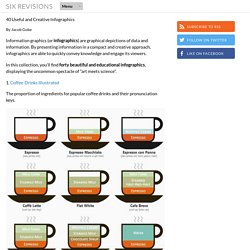
In this collection, you’ll find forty beautiful and educational infographics, displaying the uncommon spectacle of "art meets science". 1. The proportion of ingredients for popular coffee drinks and their pronunciation keys. 2. This infographic showcases the history of the Swine Flu, starting from 1976. 3. 4. 5. The top breweries and beers in the U.S. 6. 7. 389 Years Ago A rundown of the historic events in African-American culture. 8. 9. 10. 11.
An illustrated guide at how the Global Warming phenomenon works. 13. A packed visual piece on tobacco chemicals and tobacco trade worldwide. 14. 15. 16. A graphical representation of consumer spending across the globe. Steganography. Cool Infographics - Blog. Bring Reading Rainbow Back for Every Child, Everywhere.

LeVar Burton has a fantastic Kickstarter project running to bring back Reading Rainbow to make it available on multiple internet connected platforms and free to classrooms in need. The team is using multiple infographics to help explain the project and the support the funding campaign goal of raising $5,000,000. Hi. LeVar Burton here. You may know me as Kunta Kinte, from ROOTS, or Geordi La Forge, from Star Trek: The Next Generation. The infographic design above could be improved with the knowledge that people may share the infographic image without the rest of the text and information from the kickstarter page.
The visualizations help make a huge amount of information about the project easily accessible and understandable to the audience. I think this is an incredibly worthy project, and I hope you join me in contributing: