
How to implement scrollytelling with six different libraries. Rcmdr.com. LeaRning Path on R - Step by Step Guide to Learn Data Science on R. One of the common problems people face in learning R is lack of a structured path.
They don’t know, from where to start, how to proceed, which track to choose? Though, there is an overload of good free resources available on the Internet, this could be overwhelming as well as confusing at the same time. Deducer: A GUI for R - Windows Installation. All-In-One Installer for R, JGR and Deducer Download Installer Instructions for existing R users Deducer is much like any other package in R, and can be used from within the native R Gui or the Java R Gui JGR.
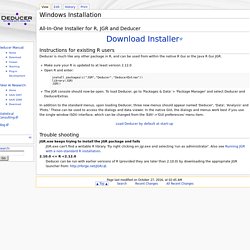
Make sure your R is updated to at least version 2.12.0 Open R and enter: install.packages(c("JGR","Deducer","DeducerExtras")) library(JGR) JGR() The JGR console should now be open. A gallery of interesting Jupyter and IPython Notebooks · jupyter/jupyter Wiki. This page is a curated collection of Jupyter/IPython notebooks that are notable for some reason (the page was created before the Jupyter name transition, and renaming the page would break all links).
Feel free to add new content here, but please try to only include links to notebooks that include interesting visual or technical content; this should not simply be a dump of a Google search on every ipynb file out there. Important contribution instructions: If you add new content, please ensure that for any notebook you link to, the link is to the rendered version using nbviewer, rather than the raw file. Simply paste the notebook URL in the nbviewer box and copy the resulting URL of the rendered version. Interactive Data Visualization for the Web. Copyright © 2013 Scott Murray Printed in the United States of America.
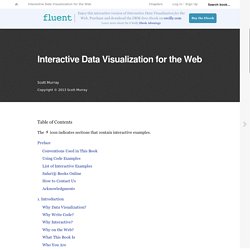
O’Reilly books may be purchased for educational, business, or sales promotional use. Online editions are also available for most titles ( For more information, contact our corporate/institutional sales department: 800-998-9938 or <corporate@oreilly.com>. Nutshell Handbook, the Nutshell Handbook logo, the cover image, and the O’Reilly logo are registered trademarks of O’Reilly Media, Inc.
Interactive Data Visualization for the Web, the cover image of a long-tail bushtit, and related trade dress are trademarks of O’Reilly Media, Inc. How to Embed Graphs in a Blog or Website. When you embed a Plotly graph, it means you’re sharing your graph, your data and the code that describes your graph all in one place.
You can embed any Plotly graph. The embedding process is the same whether you're creating graphs from the online workspace or using one of Plotly's APIs. With our interactive features, your readers have a whole new way to engage with your work. When you update a Plotly graph, the graph automatically updates on your blog or website. No need for manual updates! How to Make Your Own Bad USB « Null Byte. How to Make Your Own Bad USB Hello, everyone!
How to secretly copy (steal) files from a computer to a USB Flash drive. How-to: Make your own text-replacing Chrome extension like ‘Millennials to Snake People’ A couple weeks back you may have seen a lot of news coverage about a Chrome extension that, when installed, replaces all instances of the word ‘millennials’ on the webpages you visit with ‘snake people’.

The media seems to have this non-stop desire to write think piece after think piece about how snake peoples are a smartphone-obsessed, basement dwelling generation who expect everything on a silver spoon. If these posts are driving you crazy, Millennials to Snake People will ease the pain! Kaggle/1. Kaggle - Titanic survival prediction.ipynb at master · TheoLvs/Kaggle. Learning Python. Beginner The Python Tutorial This is the official tutorial.
It covers all the basics, and offers a tour of the language and the standard library. Learn Python The Hard Way. An Introduction to Text Mining using Twitter Streaming API and Python // Adil Moujahid // Data Analytics and more. Text mining is the application of natural language processing techniques and analytical methods to text data in order to derive relevant information.
Text mining is getting a lot attention these last years, due to an exponential increase in digital text data from web pages, google's projects such as google books and google ngram, and social media services such as Twitter. Twitter data constitutes a rich source that can be used for capturing information about any topic imaginable. This data can be used in different use cases such as finding trends related to a specific keyword, measuring brand sentiment, and gathering feedback about new products and services.
In this tutorial, I will use Twitter data to compare the popularity of 3 programming languages: Python, Javascript and Ruby, and to retrieve links to programming tutorials. Set mouse or keyboard button to simulate left click and hold or rapid left click repeating in Windows? Bubble Charts. Regex - Python string.replace regular expression. Does Python have a string contains substring method?