
4 free data tools for journalists (and snoops) Note: The following is an excerpt from Pete Warden’s free ebook “Where are the bodies buried on the web?

Introduction to Information Retrieval. This is the companion website for the following book.
Christopher D. Manning, Prabhakar Raghavan and Hinrich Schütze, Introduction to Information Retrieval, Cambridge University Press. 2008. You can order this book at CUP, at your local bookstore or on the internet. The best search term to use is the ISBN: 0521865719. A computational journalism reading list.
[Last updated: 18 April 2011 -- added statistical NLP book link] There is something extraordinarily rich in the intersection of computer science and journalism.
It feels like there’s a nascent field in the making, tied to the rise of the internet. The last few years have seen calls for a new class of “programmer journalist” and the birth of a community of hacks and hackers. Meanwhile, several schools are now offering joint degrees. The World Bank. The 70 Online Databases that Define Our Planet.
Back in April, we looked at an ambitious European plan to simulate the entire planet.
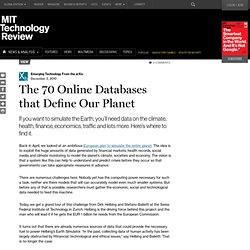
The idea is to exploit the huge amounts of data generated by financial markets, health records, social media and climate monitoring to model the planet’s climate, societies and economy. The vision is that a system like this can help to understand and predict crises before they occur so that governments can take appropriate measures in advance. There are numerous challenges here. Nobody yet has the computing power necessary for such a task, neither are there models that will can accurately model even much smaller systems. Tools to help bring data to your journalism « Michelle Minkoff. NOTE: This entry was modified on the evening of 11/9/10 to deal with typos and missing words, resulting from posting this too late the previous night.

Sleep deprivation isn’t always a good thing — although it allows one to do things more fun than sleep. Like play with data. Real-Time Data And A More Personalized Web - Smashing Magazine. Advertisement As Web designers, we face a daily struggle to keep pace with advances in technology, new standards and new user expectations.
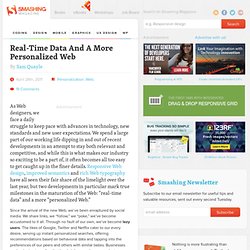
We spend a large part of our working life dipping in and out of recent developments in an attempt to stay both relevant and competitive, and while this is what makes our industry so exciting to be a part of, it often becomes all too easy to get caught up in the finer details. Responsive Web design, improved semantics and rich Web typography have all seen their fair share of the limelight over the last year, but two developments in particular mark true milestones in the maturation of the Web: “real-time data” and a more “personalized Web.” Since the arrival of the new Web, we’ve been enraptured by social media. We share links, we “follow,” we “poke,” we’ve become accustomed to it all. Web gurus and industry analysts are simultaneously arriving at the same conclusion: we are entering a new chapter in the evolution of the Web. Making open data accessible for everyone. Get the Data: Open Data Q&A Forum.
Big Data : Making sense at scale. D'un récent voyage dans la Silicon Valley (merci aux amis du Orange Institute), je rentre avec une conviction : tout ce que nous connaissions du web va changer à nouveau avec le phénomène des big data.
Il pose à nouveau, sur des bases différentes, presque toutes les questions liées à la transformation numérique. En 2008, l’humanité a déversé 480 milliards de Gigabytes sur Internet. En 2010, ce furent 800 milliards de Gygabytes, soit, comme l’a dit un jour Eric Schmidt, plus que la totalité de ce que l’humanité avait écrit, imprimé, gravé, filmé ou enregistré de sa naissance jusqu’en 2003. Ces données ne sont pas toutes des oeuvres. Outre les blogs, les textes, les vidéos (35 millions sont regardées sur Youtube chaque minute) ou le partage de musique, il y a désormais les microconversations, les applications géolocalisées, la production de données personnelles, la mise en ligne de données publiques, les interactions de l’Internet des objets...
Le web était globalement transactionnel. Orange - Data Mining Fruitful & Fun. DataMarket - Find and Understand Data — DataMarket. 5 Ways to find, mix and mash your data. One of the most popular trends in online journalism is taking publicly available data and translating it into visualizations or infographics that readers and viewers can quickly and easily understand. A large percentage of the visualizations you see on the web were built from scratch, which can take a considerable amount of time and effort. The following sites allow you to mash your data in record time. Swivel Swivel features more than 15,000 data sets for users to play with in various categories ranging from Economics to Health to Technology. From the data, users have created hundreds of thousands of graphs, charts and infographics, including the one below that visualizes the amount of rainfall in California since 1870.
Socrata Socrata is an online space for data lovers to browse datasets as well as create new visualizations to share with others. Real-Time Data And A More Personalized Web - Smashing Magazine.