
Ironfan: AMAZINGLY Build a Hadoop Cluster in 20... Nba. Databases & Linked Data. Concept Mapping Homepage. This www page has been consolidated in respect to Jan Lanzing.
The page is kept just like Jan left it behind right before he passed away on March 3, 1997. Many links have become obsolete since then. What is Concept Mapping ? Concept mapping is a technique for representing knowledge in graphs. Knowledge graphs are networks of concepts. Concepts and sometimes links are labeled. Concept mapping can be done for for several purposes: to generate ideas (brain storming, etc.); to design a complex structure (long texts, hypermedia, large web sites, etc.); to communicate complex ideas; to aid learning by explicitly integrating new and old knowledge; to assess understanding or diagnose misunderstanding.
The concept mapping technique was developed by Prof. Mind Mapping® is a popular related technique, invented (and copyrighted) by Tony Buzan in the UK. The difference between concept maps and mind maps is that a mind map has only one main concept, while a concept map may have several. Decision Explorer. Discover how Decision Explorer® can help give you a clear picture of your ideas Decision Explorer® is a proven tool for managing “soft” issues – the qualitative information that surrounds complex or uncertain situations.
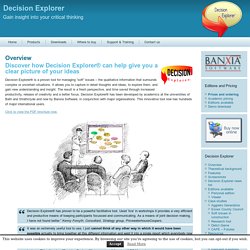
It allows you to capture in detail thoughts and ideas, to explore them, and gain new understanding and insight. The result is a fresh perspective, and time saved through increased productivity, release of creativity and a better focus. Human-Computer Interaction. Cognitive Psychology. Live is beautiful - img.ly - live activity tracking with Node.js. A lição digital « Tudo Sobre Tecnologia e Comunicação.
Soft drinks zoom.it. Graphical visualization of text similarities in essays in a book. Early stages in the process While developing the visualization algorithms, we plotted out a lot of different approaches that in the end we discarded for one reason or another.
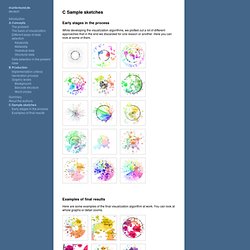
Here you can look at some of them. Examples of final results. Mapa mental. Free Mind Map Software, Freeware, Create mind maps for brainstorming, problem solving, rational analysis, and decision marking. Free mind map software help you build, save, share and print arbitrary mind maps absolutely free.
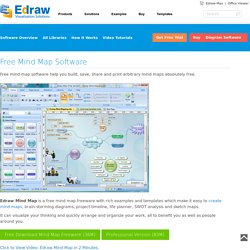
Edraw Mind Map is a free mind map freeware with rich examples and templates which make it easy to create mind maps, brain-storming diagrams, project timeline, life planner, SWOT analysis and sketch maps. It can visualize your thinking and quickly arrange and organize your work, all to benefit you as well as people around you. Click to View Video: Edraw Mind Map in 2 Minutes. Why Choose Edraw Mind Map Smart drawing guide helps to layout the mind map shapes automatically. Ready-Made Symbols for Mind Map The following template includes some logical shapes to draw a mind map. The following symbols are part of the classic flags to draw a mind map.
Smart Mind Mapping Guide Topics do automatically connect when you drag them from the Mind Shapes library. Automatic Layout Making Mind Map Drawing Easier Start from Mind Map Examples System Requirements. Visualizations. The Geotaggers' World Atlas – um álbum no Flickr.
Soft Drink Industry Structure. Output: Jens Weber & Andreas Wolter. ImpulsBauhaus. As the year marking the 90th anniversary of the establishment of the Bauhaus, 2009 was an appropriate year for an exhibition dedicated to the understanding of the social networks of the Bauhaus movement.
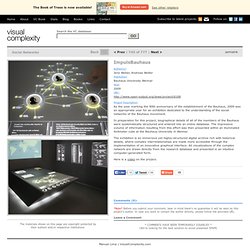
In preparation for this project, biographical details of all of the members of the Bauhaus were systematically structured and entered into an online database. The impressive volume of information resulting from this effort was then presented within an illuminated 4x4meter cube at the Bauhaus University in Weimar. The exhibition is an immersive yet highly-structured digital archive rich with historical details, where complex interrelationships are made more accessible through the implementation of an innovative graphical interface. All visualizations of the complex network are drawn directly from the research database and presented in an intuitive computer-generated form.
A visual exploration on mapping complex networks. Visualisation. Data Visualization. Commercial mindmap software. Mind Maps/ Thinking. TI_Tecnologia da INformaÇão. TCC Tecnologia. Mind Map. Data Visualization. Visual Thinking. Great examples of Visual Thinking. Brain Wiring Continues Into Young Adulthood. By Rick Nauert PhD Senior News Editor Reviewed by John M.
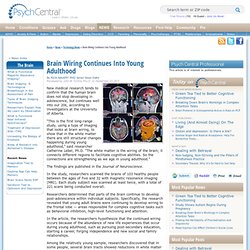
Grohol, Psy.D. on September 23, 2011 New medical research tends to confirm that the human brain does not stop developing in adolescence, but continues well into our 20s, according to investigators at the University of Alberta. “This is the first long-range study, using a type of imaging that looks at brain wiring, to show that in the white matter there are still structural changes happening during young adulthood,” said researcher Catherine Lebel, Ph.D. “The white matter is the wiring of the brain; it connects different regions to facilitate cognitive abilities. So the connections are strengthening as we age in young adulthood.” The findings are published in the Journal of Neuroscience. In the study, researchers scanned the brains of 103 healthy people between the ages of five and 32 with magnetic resonance imaging (MRI). Researchers determined that parts of the brain continue to develop post-adolescence within individual subjects.
Em experimento histórico, cientistas reconstroem visões do cérebro em vídeos digitais. Visual Literacy: An E-Learning Tutorial on Visualization for Communication, Engineering and Business. RoCC Management Insights - Prof.
Martin Eppler on Visualizing Knowledge for Management Research demonstrates the Value of Visualization for Knowledge Sharing (for Researchers) Improving Meetings through Interactive Visualization: Evidence managers can use (for Managers) Visual Literacy: An E-Learning Tutorial on Visualization for Communication, Engineering and Business. Prezi.com Blog. Instituto do Desenvolvimento do Potencial Humano. The Theory Underlying Concept Maps and How to Construct and Use. Concept maps are graphical tools for organizing and representing knowledge.
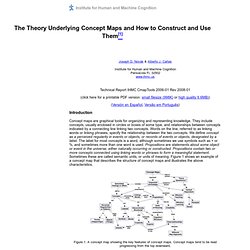
They include concepts, usually enclosed in circles or boxes of some type, and relationships between concepts indicated by a connecting line linking two concepts. Words on the line, referred to as linking words or linking phrases, specify the relationship between the two concepts.