
I-Hsien Ting
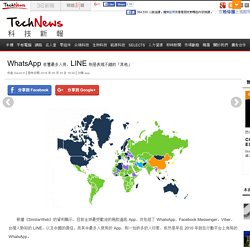
Facebook. 國立高雄大學 - National University of Kaohsiung. BI INTELLIGENCE. 不只是討拍! Facebook推自殺防治工具,用戶可回報有輕生傾向的貼文. WhatsApp 依舊最多人用,LINE 則是表現不錯的「其他」 根據《SimilarWeb》的資料顯示,目前全球最受歡迎的幾款通訊 App,共包括了 WhatsApp,Facebook Messenger,Viber,台灣人熟知的 LINE,以及中國的微信。
7 Types of Regression Techniques you should know. Introduction Linear and Logistic regressions are usually the first algorithms people learn in predictive modeling.
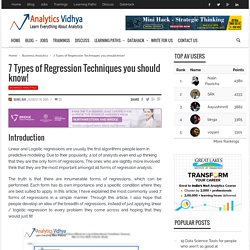
Due to their popularity, a lot of analysts even end up thinking that they are the only form of regressions. The ones who are slightly more involved think that they are the most important amongst all forms of regression analysis. The truth is that there are innumerable forms of regressions, which can be performed. Each form has its own importance and a specific condition where they are best suited to apply. Table of Contents What is Regression Analysis? What is Regression Analysis? Regression analysis is a form of predictive modelling technique which investigates the relationship between a dependent (target) and independent variable (s) (predictor).
Regression analysis is an important tool for modelling and analyzing data. 「大數據」到底與我有什麼關聯? 5 張圖,一次弄懂商業界的熱門關鍵字! 「大數據」(big data)和「資料科學家」(data scientist)是近年來商業界的熱門關鍵字。
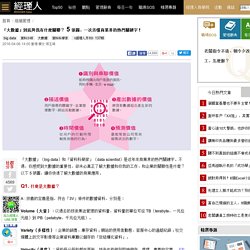
不過,你感受到大數據的重要性,卻未必真正了解大數據和你我的工作、和企業的關聯性是什麼? 以下 5 張圖,讓你快速了解大數據的商業應用。 Q1. 2015 IoT 的重要里程碑. (photo by Dragan)

352306 1. 物聯網技術大剖析. 物聯網的運作機制如同人體的神經網路,末梢神經自動感測各種訊息之後,會將訊息一路從神經網路分支匯流至主要幹道,再傳遞至人腦,由人腦研判訊息的意義後,進一步做出反應與決策。

設想一座龐大規模的物聯網正在運行著,最末端的物體如同末梢神經,網路如同中樞神經,應用系統如同人腦,當上千上萬個物體不斷製造與發送微量的感測資訊,這些資訊經由層層網路匯聚與傳遞,被推送進應用系統當中,由系統來研判與分析資訊的意義,進一步採取應對方式。 從實際用途來看,物聯網在概念上可分成3層架構,由底層至上層分別為感測層、網路層與應用層,這3層各司其職,同時又環環相扣。 Big data myths and facts. 使用 PEAR的Text_CAPTCHA保护Web表单[翻译] - mikespook - 博客园. 使用 PEAR的Text_CAPTCHA保护Web表单 作者 Marcus Whitney 翻译 mikespook 来源 当你在网络上有公开的表单的时候,你总是需要去提防那些使用你的程序来满足自己的意图的那些人。
![使用 PEAR的Text_CAPTCHA保护Web表单[翻译] - mikespook - 博客园](http://cdn.pearltrees.com/s/pic/th/pear-text-captcha-mikespook-130387478)
在论坛、开放图书馆、留言簿和BLOG上被自动提交机(原文是“robots”)找到并提交表单都是很常见的。 一种已经被很多网站与网络应用如Yahoo! 黨營事業知多少. 本文將就國民黨營事業的社會網路結構進行深入探討,資料來源為 台灣公司關係圖 6 月份資料。
前篇文章提到台灣企業生態圈中的超巨大關係企業集團,其中黨營事業處於該集團核心位置,而黨營事業又主要以中央投資為核心向外延伸。 關於國民黨黨產多寡,其實我們亦可從年 報得知,不一定要如此費心挖掘。 但本篇研究重心在於表現黨營事業的投資分佈概況,其核心人物主要以誰為主? 有哪些財團企業與黨營事業往來密切? How Twitter Handles 3,000 Images Per Second. Today Twitter is creating and persisting 3,000 (200 GB) images per second.
Even better, in 2015 Twitter was able to save $6 million due to improved media storage policies. It was not always so. Twitter in 2012 was primarily text based. A Hogwarts without all the cool moving pictures hanging on the wall. It’s now 2016 and Twitter has moved into to a media rich future. Henna Kermani, a Software Development Engineer at Twitter, tells the story of the Media Platform in an interesting talk she gave at Mobile @Scale London: 3,000 images per second. 數位時代 - 全家便利商店最近積極佈局行動商務,除了日前將原本線下的貼紙集點改成手機的 FamilyMart App...
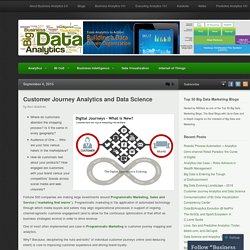
Gallery: How networks help us understand the world. As designer Manuel Lima points out in his TED Talk, A visual history of human knowledge, the network has become a powerful way to visualize much of what is going on in the world around us.
“Networks really embody notions of decentralization, of interconnectedness, of interdependence,” says Lima. “This way of thinking is critical for us to solve many of the complex problems we are facing nowadays, from decoding the human brain to understanding the vast universe out there.” Here, Lima shares a few of his favorite network graphics. The Strengths of Nations This image shows the connections between scientific disciplines such as astrophysics, math and biochemistry. Visualizing the Bible This 2007 map by Chris Harrison shows 63,779 cross-references found in the Bible. FlowerGarden This visualization by Greg Judelman and Maria Lantin shows the online discussion at a live event. RISD.tv. Customer Journey Analytics and Data Science. Where do customers abandon the shopping process?
Is it the same in every geography? Audience of One…. Who are your fans versus haters in the marketplace? How do customers feel about your products? How engaged are customers with your brand versus your competitors’ brands across social media and web channels? Fortune 500 companies are making large investments around Programmatic Marketing, Sales and Service (“marketing that learns”).
One of most often implemented use case in Programmatic Marketing is customer journey mapping and analytics. 老主顧要贈品遭酸拿太多 王品店長嗆:奧客,來鬧事的! 等公車還能吹冷氣 高市「超商公車亭」好舒適. 4 Lessons for Brilliant Data Visualization. Get some pointers on data visualization from a noted expert in the field, and gain some insight into creating your own brilliant visualizations by following these 4 lessons.
By Dr. Randal Olson. Last year, the vaccination debate was all the rage again. “Pro-vaxxers” were loudly proclaiming that everyone should get vaccinated and discussing the science behind it, and “anti-vaxxers” were casting their doubts and still refusing to get vaccinated for personal reasons. Around that time, The Wall Street Journal released a brilliant series of heat maps showing infection rates for various diseases over time, broken down by state. Today, I would like to revisit the WSJ’s heat maps through the lens of a data visualization practitioner. For the curious, I’ve released my notebook with the Python code used to generate the new visualizations. Categorical color palettes should not be used to display continuous values One exception to this “rule,” of course, is diverging color palettes. 4 Lessons for Brilliant Data Visualization. SQL Injection 範例(登入範例) @ 史丹利愛碎念. 量產Pass & Board多功能護照包HereO 群眾集資/ 群眾募資平台 Crowdfunding platform in Taiwan.
How girls hide their age :D :D - C/C++ Programming Language. I-hsien Ting - See you in New Jersey this summer! MISNC...