
Plinks: Aprender brincando é coisa desse Mondo. Fossilização. / / UW - Madison Museu de Geologia \ \ Making a Scale Drawing of Dinosaurs Author: Martin F.
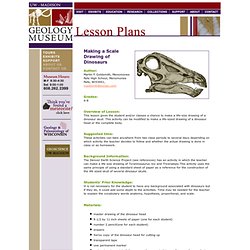
Goldsmith, Menomonee Falls High School, Menomonee Falls, WI53051, mgldsmth@exctpc.com Grades: 4-8 Overview of Lesson: This lesson gives the student and/or classes a chance to make a life-size drawing of a dinosaur skull. This activity can be modified to make a life-sized drawing of a dinosaur head or the complete body. Suggested time: These activities can take anywhere from two class periods to several days depending on which activity the teacher decides to follow and whether the actual drawing is done in class or as homework.
Background Information: The Denver Earth Science Project (see references) has an activity in which the teacher can make a life size drawing of Tyrannosaurus rex and Triceratops.This activity uses the same principle of using a standard sheet of paper as a reference for the construction of the life sized skull of several dinosaur skulls. Recursos baseados na Web, Ensino Hoje, Glencoe on-line. Aprender com o Mundo, NAO ISSO ... Só sobre.
Guia animado: Terremotos. ArvindGuptaToys Livros Gallery. For Kids Only - Earth Science Enterprise. Connect Educação. Por connecteducacao em 01/06/2012 Twitter na sala de aula O microblog está a mil entre os alunos.

Acredito ser importante até falar de internet segura, cyberbulling e sexting com eles, no uso do twitter. Uma das páginas mais acessadas entre os adolescentes permite mostrar o que pensa em 144 caracteres. Ciência mais que divertida. Summer Fun Science - Ciência NetLinks. Resources for Teachers & Educators - Lesson Plans, Videos, Online Courses - Teachers Network. Porque é que existe um longo dia e uma longa noite na Antártica? Continentes e dos bichos. Digital Wish - Planos de aula de ciências. Criando sua Rede Personal Learning (PLN) - Guia de Kathy Schrock de Tudo.
Science Education Resources. Lawrence Hall of Science - 24/7 Ciência. How fast does the wind blow?
What makes things sticky? Where do insects live and plants grow? What is the best way to clean up the environment? How do humans measure up in the animal kingdom? So many questions—and so many ways to find answers! Bridge Builders How Fast Is the Wind Gooo! Filling Without Spilling Parachute Drop Crystals Bird Beaks Sticky Situations Oil Spill How Old is Your Penny? Pegar milhares de grãos de arroz com um lápis. Pick up thousands of rice grains with a pencil Description: Learn about friction – use a pencil to pick up thousands of grains of rice.
(And no, this won’t take hundreds of years.) Equipment needed: Criando tabelas e gráficos usando JavaScript e HTML5. For website which have complicated data you may need to use graphic or charts to simplify these content to be user friend, JavaScripts charts to help you easily convert data to be graphically, user friend and clear charts .
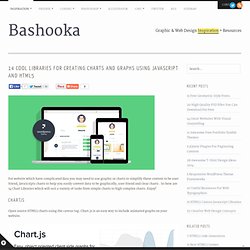
So here are 14 Chart Libraries which will suit a variety of tasks from simple charts to high complex charts. Enjoy! Open source HTML5 charts using the canvas tag. Chart.js is an easy way to include animated graphs on your website. sigma.js is an open-source lightweight JavaScript library to draw graphs, using the HTML canvas element D3.js is a JavaScript library for manipulating documents based on data.
Arbor is a graph visualization library built with web workers and jQuery. DPS Dicas HTML5 Exemplos. In DPS Tips, I included several HTML examples that are used in Web Content overlays.
I’ll attach the source files for these effects. Scratch Off Let’s start with the scratch-off effect example. Download ScratchOff.zip Create two images the same size.Name them “foreimage.jpg” and “backimage.jpg.”Unzip the file, and replace the foreimage.jpg and backimage.jpg with your images.Rename the scratch_off_v.html file, if necessary. Flip Image. 12 bibliotecas Javascript para Touch-Enabled Sliders celular. On touch screen devices you swipe left or right to browse through different images.
In the similar way touch enabled sliders allow you to swipe left or right to browse through different slides of the slider. It makes it really easy task for users to use sliders on your website. These sliders are not difficult to implement. Touch enabled sliders can be added in the same way as you add other sliders to your website or a blog. RoyalSlider is easy to use jQuery image gallery and content slider plugin with animated captions, responsive layout and touch support for mobile devices. 44 Gráfico surpreendente e Designs Gráfico. Charts and graphs are visual representations of your data.
In a chart design, data is presented in bar or line charts. A chart can represent tabular numeric data, functions or some types of qualitative structure. If you are looking for some great ideas to design graph or to design charts , here are 44 chart & graph designs which will add great effectiveness in terms of representation of data and the attraction for the viewers. Plano de Aula 2: História Local Caça ao tesouro. Acesse seus favoritos em qualquer lugar.
TICs. Artigos por Seção. Revista electrónica de investigación en educación en ciencias - Aplicação do modelo de conhecimento tecnológico, pedagógico do conteúdo (TPCK) em um programa on-line de formação continuada de professores de Ciências e Biologia.